

Weekly Crypto Market Update: Bitcoin Breaks Above $85K on a $2.65B ETF Wave as the Altcoin Season Signal Flips - September 24, 2026

Analyst Summary
Since September 17, Bitcoin has gained approximately 10.7% and is trading around $84,400. On Monday, it briefly climbed to about $87,300, its highest level since January 2026. ETH has risen roughly 11.5% and is trading near $2,700. Total crypto market capitalization stands at $2.9 trillion. Sentiment has moved to the edge of extreme greed, with the index at 74.
The main driver has been a wave of ETF demand. Since Thursday, September 17, spot Bitcoin ETFs have attracted approximately $2.65 billion and spot Ethereum ETFs approximately $641 million. Monday’s session alone brought $999 million into Bitcoin funds, the largest daily inflow since October 6, 2025. Tuesday added another $714.7 million. Notably, all of this happened against a hawkish backdrop: Fed officials pushed back against any expectations of easing, the dollar strengthened, and metals declined.
In essence, the market has confirmed the thesis we outlined in last week’s review: if Bitcoin does not sell off sharply after a hawkish Fed hike and the failure of the CLARITY Act, that is the hallmark of a genuinely strong market. This is exactly what we saw: the upside scenario played out and exceeded its targets. The rally is now spreading into altcoins, and Glassnode’s cycle indicator has flipped to altcoin season.
Key Market Snapshot
|
Asset |
7D Change |
Trend |
Analyst Bias |
|---|---|---|---|
|
+10.7% |
Uptrend |
Bullish |
|
|
+11.5% |
Uptrend |
Bullish |
|
|
Altcoins (TOTAL3ES on Tradingview) |
+14.5% |
Uptrend |
Bullish |
Last Week’s Watchlist: What Happened?
- Fed rate path (October or December): the hawkish message was reinforced by a series of speeches from Fed officials. Markets now price in roughly a 90% probability of a rate hike in December.
- BTC levels ($75,000 support; resistance at $76,600, $78,000 and $79,200–$80,000): $75,000 held. All overhead levels were then broken: first the $78,000 confirmation level, then the $79,200–$80,000 zone. Price reached $87,300.
- Spot vs. futures and open interest: spot demand recovered decisively. Aggregated spot CVD rose from about -5K to about +5K and is holding its gains. Open interest spiked to about 112.5K BTC during the breakout before falling back to about 106.4K.
- ETF flows: the $882 million outflow streak ended and reversed into inflows of approximately $2.65 billion into Bitcoin ETFs and $641 million into Ethereum ETFs.
- Brent oil and Treasury yields: on Tuesday, Brent closed below $100 for the first time since September 8, and the 10-year Treasury yield fell back below 5%.
- Scenario realized: upside. ETF outflows stopped, the CLARITY Act setback faded from focus, Bitcoin broke above $80,000, and altcoins outperformed the market.
What Moved the Market This Week?
The defining feature of the week was divergence. Traditional macro signals pointed to tighter conditions, while the crypto market rallied on its own demand.
Macro backdrop. At the start of the week, Fed officials stepped up their hawkish rhetoric. Chicago Fed President Austan Goolsbee warned that supply shocks, strong consumer spending and AI-related investment could keep inflation persistent, and that the return to 2% may not be painless. St. Louis Fed President Alberto Musalem said that early, gradual tightening is preferable and that policy remains accommodative. Boston Fed President Susan Collins and Richmond Fed President Tom Barkin also signaled that further hikes are possible. Beth Hammack (Cleveland) and Lorie Logan (Dallas) are among the most hawkish members of the committee: according to Deutsche Bank’s reading of the dot plot, they lean toward a total of 75 bps in rate hikes in 2026. The dollar index rose to 100.65, and metals declined for a second consecutive session.
Under conventional logic, this combination should weigh on crypto. Instead, against the same backdrop, Bitcoin posted the strongest daily ETF inflow of 2026.
Relief came from oil. Brent fell to around $99, driven by two factors:
- US-Iran diplomacy. President Trump said that the meeting between US officials and the Iranian delegation was “very good” and lasted about three hours.
- Saudi supply. Saudi Arabia restarted its East-West Pipeline to the Red Sea. The pipeline was shut on September 11 after drone attacks, which halted loadings at the port of Yanbu. It reroutes around 4 million barrels per day, roughly 4% of global supply.
Lower oil prices ease inflation expectations and pull down the long end of the yield curve. This works directly against the “hawkish growth scare” we have been tracking since early September.
Why are ETFs buying now? There was no single headline. Analysts describe the move as a combination of renewed risk appetite, strong ETF demand and short covering after key technical levels were broken. In our view, four factors converged.
- Regulatory substitution. On September 17, the SEC issued a temporary “Innovation Exemption” for on-chain trading of tokenized NMS stocks through automated market makers and liquidity pools. SEC Chair Paul Atkins explicitly framed the move as action taken within the regulator’s own authority after Congress failed to advance the CLARITY Act earlier that same week. The regulatory narrative did not collapse with the Senate vote. It shifted from Congress to the regulator, and tokenization became the new center of attention.
- A structural technical signal. Bitcoin closed last week at $81,159, above its 50-week moving average of $78,786. The previous weekly close above this level was on November 9, 2025, after which BTC spent 44 weeks below it. The 50-week moving average is widely seen as the dividing line between bull and bear regimes, and reclaiming it typically attracts trend-following and allocation flows.
- Forced buying. Around $648 million in short positions were liquidated within 24 hours during the breakout.
- The breakeven effect. Bloomberg’s Eric Balchunas noted that the inflows came across all funds on ordinary volume, mostly from orders placed before the September 21 breakout. Part of the ETF holder base has returned to breakeven, which has historically encouraged holders to stay in their positions rather than sell.
- Overall, the crypto market is going through a phase of independent repricing. It is driven by ETF demand, the development of tokenization and broadening institutional participation rather than by monetary easing. Even after this week, spot Bitcoin ETFs remain slightly negative for 2026, with year-to-date outflows of roughly $450–464 million. This suggests that positioning is still far from saturated.
Market Structure: A Spot-Led Breakout with Leverage Flushed Out
Chart: BTC Market Data
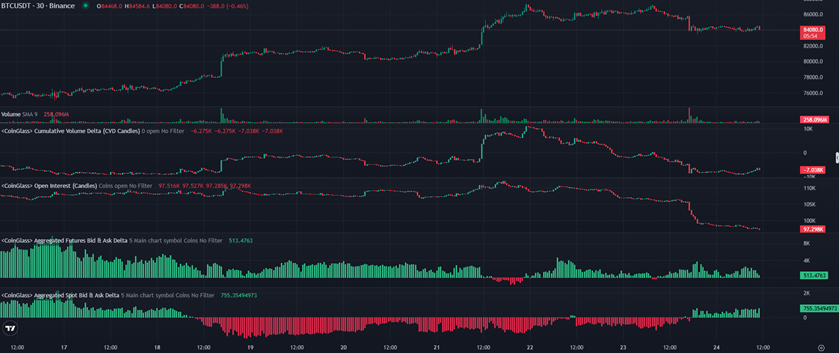
Chart source: CoinGlass
Asset: BTC/USDT
Timeframe: 30 Minutes
Metrics: Price, Volume, Cumulative Volume Delta, Open Interest, Aggregated Futures Bid & Ask Delta, Volume Delta
Data checked: September 24, 2026, 9:00 UTC
The structure of this rally is fundamentally different from the moves we analyzed in August and early September. On September 3, Bitcoin was holding its highs on leverage while the spot market was selling. This week, the picture is the opposite.
Two impulses, both led by spot. The rally unfolded in two legs: on September 18, from about $76,500 to $81,000, and on September 21, from about $81,000 to $87,300. Both breakouts were accompanied by the largest volume spikes of the period and hourly volume-delta bursts of more than 2,000 BTC, reflecting aggressive market buying. Aggregated spot CVD rose sharply in both legs, from about -5K to about +5K, and is holding near its highs at 4.39K. In other words, spot buyers absorbed the available supply and are not giving it back.
Futures took profits, and leverage was flushed out. Futures CVD behaved differently. After peaking at about +9K on September 22, it retraced to around -4.3K as futures traders locked in profits. Open interest spiked to about 112.5K BTC during the breakout and then fell to about 106.4K. That is below the level seen before the September 21 impulse, even though price is holding within about 2% of its high. The OI-weighted funding rate briefly dropped close to zero on September 22 and has since recovered to a moderate 0.0066%. This is well below the 0.03% level commonly associated with excessive long leverage.
This is a healthy combination: price is supported by spot demand, while excess leverage has been cleared out. After the second impulse, hourly volume delta turned balanced, with a slight negative bias. Buyers are not chasing price at $86,000–$87,000, which is typical of consolidation after a strong move rather than of distribution.
The large-order map shows the boundaries of the range. Whale orders on centralized exchanges have moved sharply higher along with price. A week ago, the main bids sat at $73,000–$75,000.
Supply above:
- about $8.6 million at $85,880, a fresh order placed just above the market;
- a cluster at $86,000–$86,300;
- about $9.9 million at $87,000, followed by a ladder of orders at $87,100–$87,600;
- about $15.7 million at $88,000, including a block of roughly $12.7 million that has been in place for more than three weeks;
- about $4 million at $88,888.
Demand below:
- about $10.4 million at $85,000;
- $84,000–$84,500;
- about $6 million at $83,000.
The effective range is roughly $85,000–$88,000, with the immediate battle taking place at $85,000–$86,300. Importantly, the $87,000–$87,300 zone has already rejected the price twice, on September 21 and September 23. This is where a local double top could form if buyers fail to absorb it.
The options expiry adds another variable. Deribit’s quarterly BTC and ETH options expire on Friday, September 25, at 08:00 UTC. Bitcoin accounts for about $14.63 billion of the $16.6 billion total, and Ethereum for about $1.93 billion. Earlier in the month, the estimated max-pain level was in the $72,000–$75,000 range. That is far below the current price, which means a significant share of calls is deep in the money. According to the latest Coinbase data, the largest call concentrations are at the $90,000 and $100,000 strikes. The settlement of such a large quarterly expiry removes a layer of dealer hedging. Volatility often expands in the days following quarterly expiries, in either direction.
What to Watch Next
The key question for the coming days is whether ETF demand will survive the quarterly expiry. If inflows continue after Friday’s settlement, it would confirm that the demand is structural rather than linked to expiry positioning or quarter-end flows.
Technically, holding the demand zone around $85,000 keeps the consolidation constructive. A move through $86,300 and then $87,300 would bring the $88,000 wall back into focus. A break below $85,000 would open the way toward bids at $84,000 and $83,000.
On the macro side, the calendar becomes busier starting next week. This matters because the data will shape expectations for the next Fed decision. This week:
- initial jobless claims on Thursday, September 24;
- durable goods orders on Friday, September 25.
Next week:
- JOLTS and the Conference Board Consumer Confidence Index on September 29;
- ADP employment, the third estimate of Q2 GDP, and the August PCE price index along with personal income and spending on September 30;
- the September employment report on Friday, October 2.
Consumption, inflation and labor market data will determine whether expectations for a December hike shift closer to the October 28 meeting or fade.
Analyst Opinion: A Strong Market Has Earned a Bullish Bias, but It Needs to Digest the Rally
Current view: Bullish, with a high probability of near-term consolidation. The confirmation conditions from last week’s review have been fully met: a daily close above $78,000 alongside an end to ETF outflows. The bias therefore shifts from neutral to bullish. After a 10% rally and with the sentiment index at 74, a pause within the $85,000–$88,000 range would be healthy rather than a warning sign.
Rationale:
- For the bulls: $2.65 billion in Bitcoin ETF inflows, a spot-led breakout with leverage flushed out and moderate funding, and a weekly close above the 50-week moving average. Whale bids have moved up to $83,000–$85,000, and tokenization has emerged as a new regulatory catalyst.
- Against: a hawkish Fed and a strengthening dollar, heavy supply at $87,000–$88,000, and sentiment at the threshold of extreme greed. A quarterly expiry and a busy macro calendar lie ahead.
Confirmation level: A daily close above $88,000 that absorbs the wall, together with continued ETF inflows after the September 25 expiry, would open the way toward the $90,000 area, where the largest call concentrations are located.
Invalidation: A daily close below $83,000 would shift focus back to the $80,300–$82,000 breakout zone and the $81,159 weekly close. A move below $81,000 would call the breakout itself into question.
Trading takeaway: The trend has turned constructive, but chasing price directly beneath a heavy supply wall ahead of a large expiry offers a poor risk-reward ratio. It is more sensible to watch how the market behaves at the edges of the range: absorption of $88,000 or a defense of $85,000. Post-expiry volatility can reverse sharply in either direction, so risk management remains the priority.
Scenarios for the Week Ahead
Neutral scenario. Bitcoin consolidates within the $85,000–$88,000 range ahead of Friday’s expiry and next week’s data. ETF inflows slow but remain positive, open interest gradually rebuilds, and the market digests its gains. This is the most likely near-term outcome.
Upside scenario. ETF inflows continue after the expiry, oil stays below $100, and new data does not add hawkish pressure. Bitcoin absorbs the $88,000 wall and moves toward $90,000, while altcoins continue to extend their gains.
Downside scenario. Post-expiry hedge unwinding coincides with a stronger dollar and hot consumption and inflation data on September 30, or with a renewed oil spike if US-Iran talks break down. A break below $85,000 opens the way to $84,000–$83,000. If those levels fail to hold, a deeper pullback toward the $80,300–$82,000 breakout zone is possible.
In Focus: The Altcoin Season Signal - Why the Rotation Favors Fundamentally Strong Projects
Chart: Month-to-Date Performance of Crypto and Technology Sectors
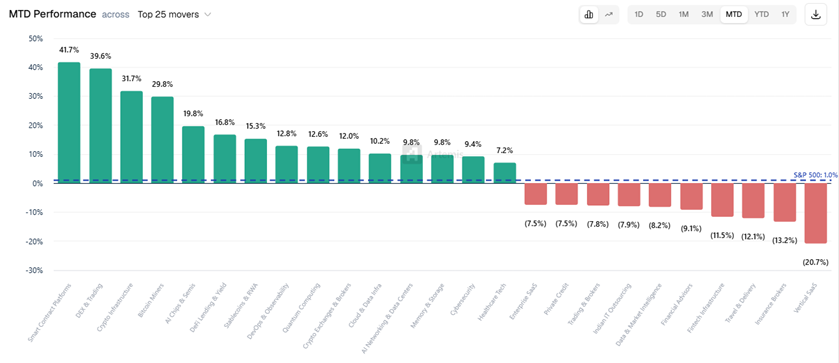
Chart source: Artemis
Asset/market: Thematic sector indices vs. the S&P 500
Timeframe: MTD
Metric: Sector price performance
Data checked: September 24, 2026, 9:00 UTC
For most of this year’s recovery, altcoins lagged behind Bitcoin. This week, that changed. Glassnode explicitly flagged the shift: its altcoin cycle indicator has flipped from Bitcoin season to altcoin season. During the August rally, altcoins barely moved while BTC climbed, but the latest advance has spread across the entire altcoin market.
What the signal measures. The indicator rose to 81.25 on a 0–100 scale. The combined market capitalization of the 250 largest tokens, excluding stablecoins, reached about $1.19 trillion, while Bitcoin dominance remained near 59.7%. In other words, based on relative performance, the model now favors a broad basket of altcoins over Bitcoin.
This signal should not be overstated. Blockchain Center’s Altcoin Season Index stood at 49 on September 22, well below the 75 threshold at which the service declares altcoin season. Its methodology requires 75% of the top 50 coins to outperform Bitcoin over 90 days. Analysts also note that the Glassnode signal lags price action. Its durability depends on whether altcoins can maintain their relative strength if Bitcoin moves into consolidation. The accurate reading today is an emerging rotation, not a confirmed, full-scale altcoin season.
The common thread: value accrual and tokenization. The leaders are not random. Many of them are protocols that either direct revenue to token holders or position themselves as infrastructure for tokenized assets. Uniswap is the clearest example, combining both drivers:
- Value accrual. The UNIfication proposal, approved in December 2025 with 99.9% support, activated protocol fees across Uniswap v2, v3 and v4 and directs them toward automated UNI buybacks and burns.
- Regulatory fit. The SEC’s Innovation Exemption aligns closely with Uniswap v4’s Permissioned Pools, launched in July 2026 with partners including Superstate and Securitize. Following the announcement, UNI rose 18.67% in 24 hours to $9.05.
- RWA demand. Uniswap reported that more than 60% of all real-world asset trading volume on DEXs passed through the protocol in a single week.
- A similar model. Ethena uses a comparable ENA buyback model, the effect of which likewise depends on ongoing protocol revenue.
- This marks a qualitative shift from previous cycles. Tokens are increasingly valued on revenue, buybacks and regulatory positioning rather than on narratives alone.
Where Ethereum stands. ETH rose about 11% over the week, while spot ETH ETFs attracted about $641 million. Of that, $270 million came in on Monday, the largest daily inflow since October 7, 2025. However, ETH moved broadly in line with Bitcoin rather than outperforming it. For now, the rotation is being led by DeFi, trading venues and infrastructure tokens rather than by ETH itself. A sustained rise in ETH/BTC would be one of the key confirmations that the rotation is developing into a broad altcoin season.
What would confirm the altcoin season thesis, and what would break it.
Confirmation signals:
- a decisive decline in Bitcoin dominance below the current ~59.7%;
- an uptrend in ETH/BTC;
- 90-day market breadth indices moving toward the 75 threshold;
- most importantly, altcoins maintaining their relative strength while Bitcoin consolidates below $88,000.
Risks:
- The signal is lagging and can reverse as quickly as it flipped.
- Altcoin liquidity is thinner, so leveraged moves unwind more sharply.
- Parabolic 90-day gains in some coins increase the risk of sharp corrections and pressure from token unlocks.
- Any macro shock hits altcoins harder than Bitcoin.
Practical takeaway. The current phase favors a selective approach. The structural drivers of this rally, namely tokenization, protocol revenue and institutional access, apply to a specific set of fundamentally sound projects: DEXs, yield infrastructure, scaling networks and oracles. They do not extend to the altcoin market as a whole. The rotation is real, but it has not yet been confirmed by either market breadth indices or Bitcoin dominance.
Risks for the Week Ahead
- A hawkish Fed and a strong dollar. Markets assign a high probability to a December rate hike, and hawkish remarks from Fed officials are pushing the dollar higher. Further dollar strength is the main macro headwind for the rally.
- Macro data. Consumption and inflation data (PCE on September 30) and the October 2 employment report could pull hike expectations forward to the October 28 meeting.
- The quarterly options expiry. The $16.6 billion Deribit expiry on September 25 could unleash volatility as dealers unwind their hedges.
- Sentiment index at 74. Readings at the threshold of extreme greed have often preceded local pullbacks.
- Oil and geopolitics. The Houthis continue to attack Saudi infrastructure, and a breakdown in US-Iran talks could push Brent back above $100.
- An ETF flow reversal. A return to outflows after the expiry, or selling by holders who have returned to breakeven, would undermine the main source of support.
- Leverage in altcoins. The rotation into altcoins increases exposure to sharper liquidation cascades in less liquid markets.
Watchlist for the Week
- Deribit quarterly expiry: September 25, 08:00 UTC, $16.6 billion (BTC $14.6 billion, ETH $1.9 billion); market behavior in the days after settlement.
- ETF flows: whether inflows into Bitcoin and Ethereum ETFs continue after the expiry.
- BTC levels: support at $85,000, followed by $84,000–$83,000; resistance at $85,900–$86,300, $87,000–$87,300 and the $88,000 wall.
- Spot vs. futures, open interest and funding: whether spot CVD holds its gains and whether leverage (~106K BTC) starts to build up again.
- US macro calendar: jobless claims (September 24); durable goods orders (September 25); JOLTS and consumer confidence (September 29); PCE, personal spending and GDP (September 30); ISM Manufacturing (October 1); the employment report (October 2).
- DXY, Brent and the 10-year Treasury yield: as sources of pressure or relief.
- Altcoin rotation: Glassnode’s altcoin cycle indicator, Bitcoin dominance (~59.7%) and the ETH/BTC trend.
Final Takeaway
This week confirmed the thesis from our previous review: a market that withstands a hawkish Fed hike and a regulatory setback is a strong market. Bitcoin rallied about 10%, reclaimed its 50-week moving average and reached about $87,300. It did so on roughly $2.65 billion of spot ETF inflows, even as Fed officials turned more hawkish and the dollar strengthened. The quality of the move matters as much as its size. The breakout was led by spot demand, excess leverage was flushed out, and funding remains moderate. This is the opposite of the fragile, leverage-driven structure of early September.
The rally is now broadening into altcoins, with the greatest strength seen in fundamentally sound sectors: DEXs, yield infrastructure, scaling networks and tokenization infrastructure.
The next test will come quickly: Friday’s $16.6 billion options expiry, followed by a busy macro calendar. Bitcoin is consolidating between bids at $85,000 and heavy supply at $87,000–$88,000. Continued ETF inflows after the expiry would confirm the structural nature of demand. A daily close above $88,000 would open the way toward $90,000. Until then, the priority is defending $85,000 and managing risk rather than chasing the move.
Methodology
This weekly update analyzes crypto market structure, technical indicators, liquidity and market depth, derivatives positioning, options and liquidation data, on-chain activity, and market sentiment alongside asset price performance. It also incorporates relevant macroeconomic, corporate, and regulatory developments. The analysis is based on information available at the time of publication and may change as new market data emerges.
Disclaimer
This report is provided for educational and informational purposes only and should not be considered financial, investment, or trading advice. Cryptocurrency markets are highly volatile, and past performance is not indicative of future results. Always conduct your own research and carefully assess your risk tolerance before making any investment or trading decisions.