


Weekly Crypto Update August 20, 2026 - BTC Surges 10% on Treasury Buybacks and a Record Short Squeeze | XBO

Analyst Summary
The market picture changed sharply this week: since August 19, bitcoin has risen 10% and is now trading around $71,200, decisively breaking above and holding the $62,000-$67,000 range. The trigger was news that the U.S. Treasury is expanding its purchases of long-term bonds, with the notional size of operations involving 10-20-year and 20-30-year securities set to increase from $2 billion to at least $4 billion per operation starting September 9. While the amount is small relative to total U.S. debt and the Treasury’s balance sheet, the market interpreted the move as a sign of systemic weakness and a catalyst to buy bitcoin as a hard asset, similar to gold.
The rally was further amplified by one of the largest liquidation waves in history, with approximately $2.7 billion in short positions forcibly closed. Importantly, the Treasury bond purchases did not inject new money into the economy; instead, they provided a narrative catalyst and triggered a mechanical short squeeze. Spot order delta remains negative due to the accumulated supply we highlighted in the previous review, while whales have yet to move their buy orders up toward current price levels.
The bullish scenario has played out, but so far the move remains event-driven.
Key Market Snapshot
|
Asset |
7D Change |
Trend |
Analyst Bias |
|---|---|---|---|
|
+12.3% |
Uptrend |
Bullish |
|
|
+20.9% |
Uptrend |
Bullish |
|
|
Altcoins (TOTAL3ES on Tradingview) |
+9.1% |
Uptrend |
Bullish |
Last Week's Watchlist: What Happened?
- July PPI and retail sales: Both came in soft, reinforcing the disinflationary trend and signs of cooling consumer demand, which reduced the risk of a Fed rate hike.
- $65,000 upper boundary: Tested on August 18 and decisively broken on August 19 following the news-driven move - the previous $62,000-$67,000 range is no longer relevant.
- $62,500 buy wall / $62,000 bid: Neither level was tested as price moved sharply higher.
- ETF flows: Inflows totaled $706 million last week, with an additional $517 million following the breakout.
- Realized scenario: Bullish, but event-driven.
What Moved the Market This Week?
Chart: U.S. Treasury General Account Balance
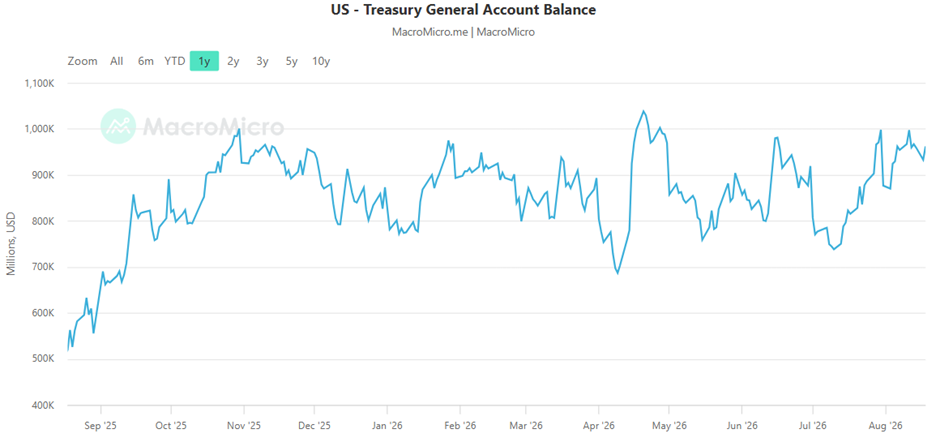
Chart source: MacroMicro
Asset/market: U.S. Treasury General Account (TGA) Balance
Timeframe: Daily
Metric: Treasury cash balance, USD millions
Data checked: August 20, 2026, 09:00 UTC
The main driver was a macro-policy news shock. The U.S. Treasury announced an expansion of its long-term bond buyback program: operations in 10-30-year maturities will at least double to $4 billion starting September 9. Formally, this is a debt and liquidity management measure aimed at replacing less liquid long-dated issues, but the market interpreted the announcement more broadly - as a sign that the system requires support, reinforcing the case for hard assets such as bitcoin and gold.
It is important to put the mechanics into perspective. Bond buybacks are not QE and do not amount to “money printing”: the operation does not create bank reserves, and when financed through Treasury bills, it effectively amounts to exchanging long-term debt for short-term debt. It improves market liquidity and supports prices of long-duration bonds, but does not directly increase the money supply. As a result, bitcoin was driven not by expectations of “new money,” but by a combination of the fiscal-weakness narrative and a powerful technical catalyst - one of the largest liquidation waves on record, with around $2.7 billion in short positions forcibly closed within 24 hours on exchanges. Such a short squeeze can amplify a move sharply, but by its nature it is temporary: once forced buying is exhausted, the rally loses its fuel.
Market Structure: A Powerful Breakout That Still Lacks Spot Confirmation
The key question now is whether the breakout is being confirmed by genuine demand, and the data suggest caution. Futures order-flow delta is positive, indicating active buying in derivatives. Spot delta, however, remains negative: a significant amount of sell-side liquidity has accumulated at current levels, suggesting that spot participants are more inclined to take profits than chase the rally. Whale activity is also telling: they have yet to show meaningful buying interest or move large bids closer to current levels - the largest buy orders remain significantly lower, around $64,000-$65,000.
It is also important to monitor the fiscal implementation. The Treasury’s cash balance at the Fed remains elevated at around $930 billion, and the way the buybacks are financed will determine their impact on liquidity. If they are funded by drawing down the Treasury’s account, reserves would flow into the financial system, potentially supporting risk appetite. If they are financed through Treasury bill issuance, the effect would be closer to a liquidity-neutral twist. For now, this remains more a matter of expectations than an actual liquidity injection.
What to Watch Next
The key question this week is whether spot demand will join the rally at current levels. We are watching spot delta and whether whales begin moving their buy orders closer to current prices: without this confirmation, the current price breakout remains vulnerable. ETF flows are equally important - an acceleration in inflows would provide further confirmation that genuine demand is entering the market.
The main events to watch are the Jackson Hole symposium and any signals from the Fed on the rate path, as well as Nvidia’s earnings report on August 26, which is covered in a separate section below. A sharp market reaction could either reinforce or disrupt the current momentum through tail-end correlation. We are also closely monitoring how the Treasury finances the buybacks, as this will determine their actual impact on market liquidity.
Analyst Opinion: A Strong Breakout, but Confirmation Is Everything
Current view: The outlook has shifted to cautiously bullish. The breakout above $67,000 is a strong technical signal, with bitcoin finally moving out of its range for the first time in months. However, the quality of the move remains questionable: the rally has been driven by the news narrative and a major short squeeze, leaving it vulnerable to a pullback unless spot demand continues to strengthen.
Rationale: The bullish case is supported by the range breakout, positive futures delta, and a supportive liquidity and hard-asset narrative. Against this are negative spot delta, limited whale activity at current levels, and the one-off nature of the short squeeze. Structurally, this suggests that the fundamental demand underpinning the price is still weaker than the magnitude of the move itself.
Confirmation level: A shift in spot delta toward buying, whales moving bids closer to current levels, and accelerating ETF inflows would confirm that the breakout is developing into a sustained trend.
Invalidation: If the squeeze fades without spot confirmation while accumulated supply continues to pressure the market from above, bitcoin risks falling back toward $67,000.
Trading takeaway: The breakout is powerful but event-driven, so priority remains with confirmation from spot demand and ETF flows. Key indicators are the ability to hold current levels and the synchronization of spot and futures flows toward buying as a condition for further upside.
Scenarios for the Week Ahead
Bullish scenario (trend initiation). If the momentum is supported by positive economic data and spot buying, with spot and futures markets becoming aligned on the buy side, this would likely mark the beginning of a broader crypto market uptrend. Bitcoin has already established itself above $67,000 - the key level we have been highlighting throughout this period - and confirmation from spot demand would open the path higher toward $72,000-$73,700, where the next major sell orders are concentrated.
Neutral scenario. Bitcoin digests the squeeze above $67,000, but spot demand remains hesitant after the initial move. Price consolidates around $69,000-$70,000 as the market awaits confirmation from economic data, Jackson Hole, Nvidia’s earnings, and the implementation of the Treasury’s buyback policy.
Bearish scenario. The squeeze fades without new spot demand entering the market, while accumulated supply and passive whale activity take over, pushing bitcoin back toward $67,000.
In Focus: Nvidia's August 26 Earnings - A Referendum on the AI Trade and a Risk Event for Crypto
Chart: Nvidia Revenue By Market Platform
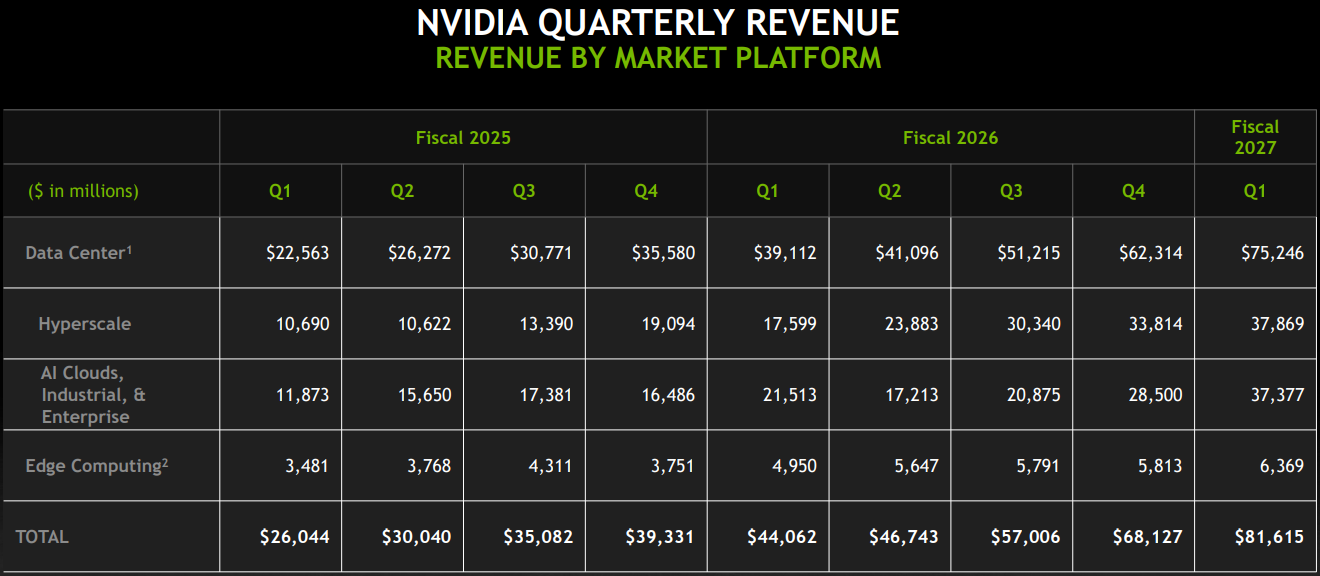
Chart source: Nvidia Investor Relations, company filings
Asset/market: Nvidia (NVDAX)
Timeframe: Quarterly
Metric: Revenue By Market Platform
Data checked: August 20, 2026
Next week, on Wednesday, August 26, Nvidia will report after the market close - and this is arguably the most important event for the entire AI trade. It matters to us for two reasons: XBO offers tokenized Nvidia shares, and, as we have shown repeatedly, bitcoin tends to move alongside the semiconductor sector during periods of sharp technology-driven shocks. Nvidia's August 26 earnings are therefore also a potential risk event for crypto.
First, the key numbers to watch. Analyst consensus expects second-quarter fiscal-year revenue of around $91.8 billion, slightly above management's own guidance of $91.0 billion ±2%, with EPS expected at around $2.08. Data Center remains the key growth driver: the segment generated $75.2 billion in the previous quarter, accounting for around 92% of total revenue, with gross margins of roughly 75%, while the Blackwell architecture is already in volume production. In other words, Nvidia today is effectively a concentrated bet on demand for AI infrastructure.
This is where the broader context becomes important. As we discussed in previous reports, hyperscalers have collectively raised their AI capex guidance in recent earnings: Microsoft is targeting $255-260 billion for fiscal 2027, Amazon $220 billion, Meta $130-145 billion, and Alphabet $195-205 billion. Their capex is, in effect, future revenue for Nvidia, so the demand outlook remains positive. But there is another side to the story: the market is now punishing spending without clear returns. In the July earnings season, Alphabet, Meta, and Apple shares fell on concerns about the return on AI investment, while Microsoft and Amazon, which demonstrated tangible monetization, gained. Nvidia's report will therefore serve as a referendum on the broader AI infrastructure thesis.
What really matters - and this is more important than simply beating consensus - is, first, the outlook for the next quarter. Second, watch the trajectory of gross margins around 75%: any meaningful decline could signal pricing pressure or rising costs from expensive memory and advanced packaging. Third, monitor commentary on China: export restrictions and the accelerating domestic Chinese semiconductor industry following CXMT's record IPO remain key wildcards. Finally, watch for any indications that customers themselves are beginning to question the returns on their AI investments.
This creates three potential market scenarios. A strong report with confident guidance would validate the AI infrastructure thesis, improve risk appetite, and indirectly support bitcoin. A report broadly in line with expectations but accompanied by cautious guidance could trigger a “sell-the-news” reaction, similar to what we saw with the hyperscalers. A weak report, margin compression, or a negative development around China could trigger a broader repricing of the AI trade and a sell-off that spills over into crypto.
The January 2025 DeepSeek episode provides a useful precedent. Following the release of DeepSeek, Nvidia shares lost a record $589 billion in a single session, while bitcoin fell 6-7%. Correlation, which is typically low during calm market conditions, can spike during a technology shock. For holders of tokenized NVDA and the broader crypto market alike, August 26 is therefore a known event risk that warrants careful risk management.
At the same time, it is important not to overstate the downside. As we noted previously, even a weak earnings report would not necessarily invalidate the structural demand for AI infrastructure if AI utilization continues to grow faster than the cost of computing falls. This is the Jevons paradox, and it ultimately works in favor of hardware suppliers.
Risks for the Week Ahead
- One-off nature of the short squeeze. The rally was driven by one of the largest short-liquidation waves on record, along with spot demand during the initial move. However, spot activity has since weakened.
- Limited spot confirmation at current levels. Spot delta remains negative, while whales have not moved their buy orders closer to current levels - meaning the breakout still lacks strong underlying support.
- Rising leverage and fresh long positions. Open interest surged after the squeeze; traders chasing the breakout with leverage create the risk of a reversal - and a new wave of long liquidations - on the first meaningful pullback.
- Heavy overhead supply. Large sell orders around $72,000-$73,700 could limit further upside.
- Narrative risk. If the market reinterprets the expanded bond buyback program as routine debt management rather than a signal of fiscal weakness, the “hard-asset” bid could fade. Moreover, if the buybacks are financed through Treasury bill issuance, there will be no meaningful liquidity injection - making it a liquidity-neutral twist rather than QE.
- Nvidia earnings on August 26. A key event risk for the entire AI trade: a sharp move in Nvidia shares could disrupt crypto momentum through tail-end correlation.
Watchlist for the Week
- Spot delta and whale activity: a shift toward spot buying and whales moving their bids closer to current levels.
- Spot BTC and ETH ETF flows: accelerating inflows as confirmation of genuine demand.
- BTC levels: $69,000 as key downside support; $70,000 resistance, followed by major sell walls at $71,000-$73,700; whale demand zone at $64,000-$65,000.
- Bond buyback financing: whether the Treasury funds the purchases by drawing down its account at the Fed (adding reserves) or through Treasury bill issuance (liquidity-neutral twist).
- Jackson Hole and Fed signals.
- Nvidia earnings (August 26): a key event risk for both the AI trade and crypto.
Final Takeaway
Bitcoin has sharply changed its market structure: a 10% rally since August 19 has pushed it above and out of a multi-week trading range. The move was driven by the narrative around the Treasury’s expanded government bond buyback program and one of the largest short-liquidation waves on record. However, it is important to note that the bond buybacks are a debt-management operation, not QE: they improve market liquidity but do not directly increase the money supply. Spot delta is currently negative, while whales have not moved their bids closer to current levels, leaving the breakout without firm underlying support for now. For this move to mark the beginning of a sustained crypto market uptrend, it would need to be supported by favorable macro data and synchronized buying across both spot and futures markets. Until that confirmation arrives, the priority remains holding $69,000, monitoring spot delta and ETF flows, and staying prepared for volatility around Jackson Hole and Nvidia’s earnings.
Methodology
This weekly update analyzes crypto market structure, technical indicators, liquidity and market depth, derivatives positioning, options and liquidation data, on-chain activity, and market sentiment alongside asset price performance. It also incorporates relevant macroeconomic, corporate, and regulatory developments. The analysis is based on information available at the time of publication and may change as new market data emerges.
Disclaimer
This report is provided for educational and informational purposes only and should not be considered financial, investment, or trading advice. Cryptocurrency markets are highly volatile, and past performance is not indicative of future results. Always conduct your own research and carefully assess your risk tolerance before making any investment or trading decisions.



.png)