

Weekly Crypto Market Update: Bitcoin Climbs to ~$79K on Record ETF Inflows, but a Hawkish Growth Scare Looms Into CPI - September 10, 2026
Analyst Summary
Since September 3, Bitcoin has gained approximately 1.3% and is trading around $78,000, while ETH has risen 3.7% to approximately $2,500, and altcoin market capitalization has jumped 5.6%. Sentiment remains in greed territory, with the index at 70.
The main support has come from ETF flows: spot BTC ETF inflows totaled an impressive $738.5 million over the week - a sharp reversal after weak inflows the previous week - while ETH funds attracted $178 million. In other words, the ETF flow divergence reversed in favor of Bitcoin this week.
On September 3, Bitcoin once again attempted to break through the $82,000 resistance level but pulled back into the range, while overheated futures leverage was partially unwound, improving the market structure. At the same time, the external backdrop remains tense: oil is trading around $100, 10-year U.S. Treasury yields are near 4.8%, and following a strong labor-market report, the market is pricing a roughly 55-60% probability of a September Fed rate hike.
The neutral-to-positive scenario has played out, but the week is unfolding in wait-and-see mode ahead of Friday's inflation release.
Key Market Snapshot
|
Asset |
7D Change |
Trend |
Analyst Bias |
|---|---|---|---|
|
+1.3% |
Uptrend |
Neutral-to-bullish |
|
|
+3.7% |
Uptrend |
Neutral-to-bullish |
|
|
Altcoins (TOTAL3ES on Tradingview) |
+5.6% |
Uptrend |
Neutral-to-bullish |
Last Week's Watchlist: What Happened?
- $76,000 support: held - the price not only avoided a breakdown but also moved higher, with demand shifting up into the $77,000 area.
- $80,000-$82,000 sell wall: on September 3, Bitcoin once again tested $82,000 but was rejected - overhead supply kept the price capped.
- Leverage and market structure: the move toward $82,000 was again driven by futures, after which open interest declined as some leverage was unwound.
- ETF flows: the divergence reversed - Bitcoin funds attracted $858.8 million versus $143.6 million for ETH funds.
- Labor market: strong August payrolls (+162,000) kept expectations for a hawkish Fed elevated.
- Iran and oil: the escalation continued, with Brent moving toward $100.
- Scenario realized: neutral-to-positive - the range held, with another attempt at an upside breakout.
What Moved the Market This Week?
The macro backdrop remained the dominant theme, but it took on a somewhat unusual character. Following a strong labor-market report - with 162,000 jobs added in August - and the Fed Chair's Jackson Hole remarks, which we discussed previously, the market is now pricing a roughly 55-60% probability of a September rate hike. With oil trading around $100 and Treasury yields near 4.8%, concerns are growing that the economy and inflation may prove too resilient relative to current asset valuations.
The important nuance is that this is not yet a classic flight to safety. Equities are declining, but the long end of the Treasury curve is also failing to attract meaningful safe-haven demand. In other words, the market is not primarily worried about a recession - it is worried about inflation and persistently high rates. This is a hawkish growth scare, where strong economic data weighs on risk assets while bonds fail to provide the usual defensive hedge.
Against this backdrop, crypto's performance looks notably different. Despite the challenging macro environment, Bitcoin, ETH, and altcoins all moved higher, driven primarily by the strongest spot BTC ETF inflows seen in recent weeks. In other words, crypto-specific demand outweighed the external macro pressure this week.
On September 3, Bitcoin attempted to break through $82,000 once again but was rejected by a dense layer of overhead supply and returned to the range.
Market Structure: Leverage Flushed, and a Balanced Two-Sided Market
Chart: BTC Market Data
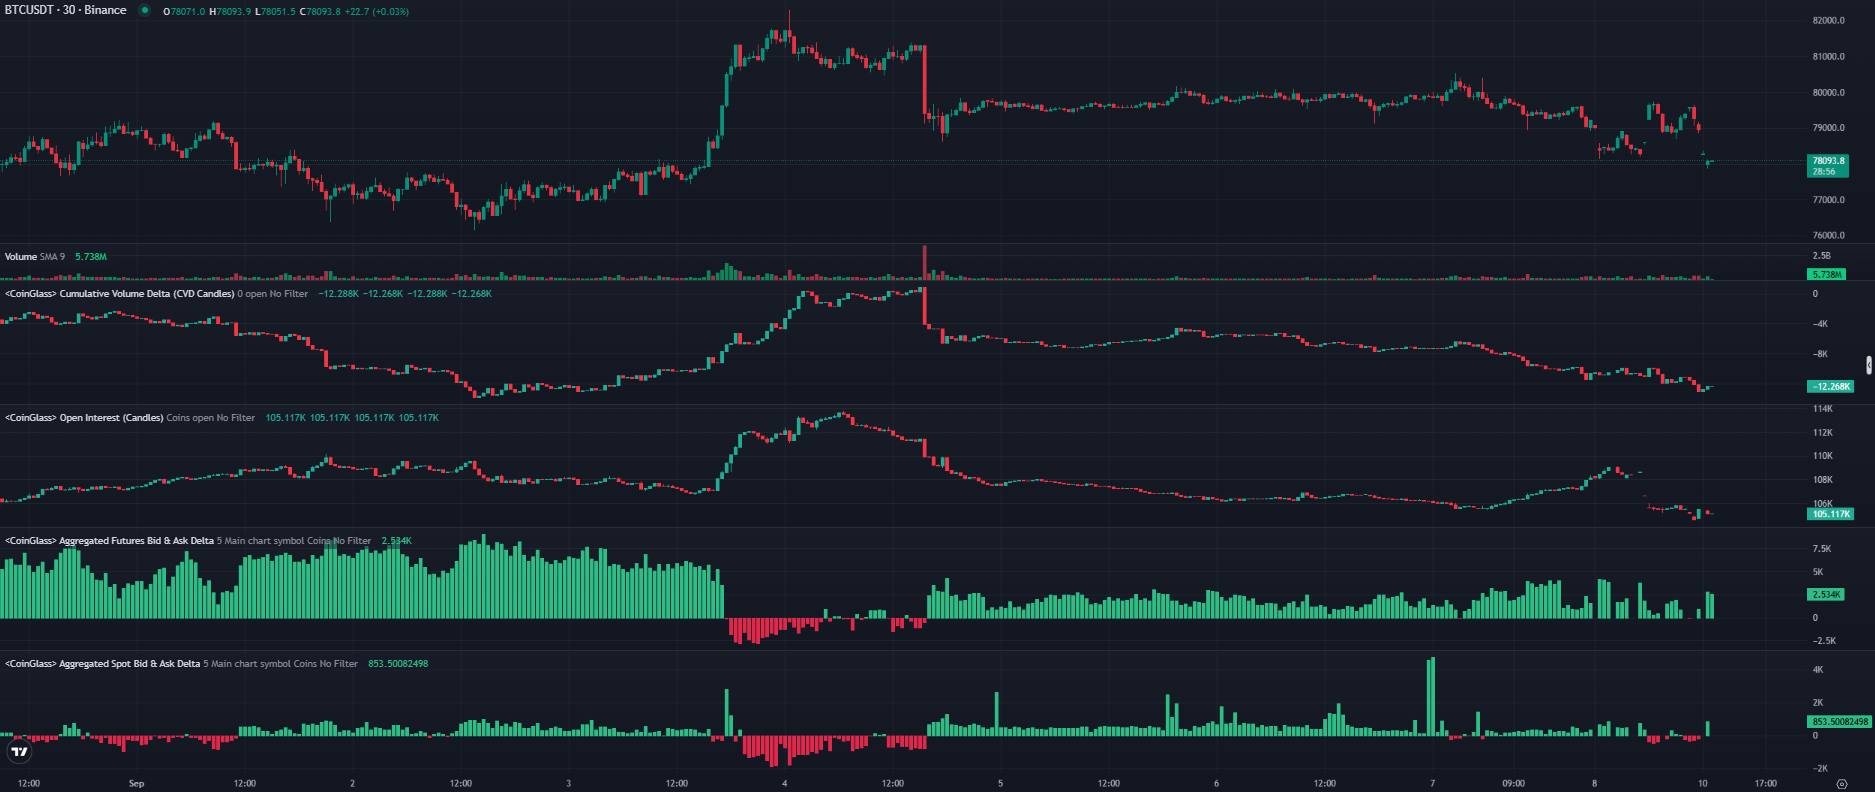
Chart source: CoinGlass
Asset: BTC/USDT
Timeframe: 30 Minutes
Metric: Volume, Cumulative Volume Delta, Open Interest, aggregated futures and spot bid/ask delta
Data checked: September 10, 2026, 09:00 UTC
Under the hood, the market structure changed over the week, and mostly for the better. The move toward $82,000 on September 3-4 was again leverage-driven: open interest and futures delta surged sharply. However, after the rejection, open interest was unwound, falling from roughly 113,000 to 105,000-106,000 BTC. In other words, overheated leverage was partially flushed out, leaving the structure healthier.
Futures delta is now predominantly positive again, indicating that buyers remain active, while spot delta is close to neutral with a slight positive bias: spot participants on centralized crypto exchanges are not aggressively chasing the move higher. At the same time, cumulative volume delta continues to drift lower gradually, pointing to persistent but moderate selling pressure. Overall, leverage has been partially flushed out, but organic spot momentum remains weak, with the market being supported by ETF inflows rather than direct spot buying on exchanges.
The whale order map shows that the range has shifted higher, while whales have become more active on both sides of the market. Overhead supply has strengthened further: around $17 million is concentrated at $82,000, roughly $13.5 million at $81,000, plus another large block at $80,000. On the downside, support has moved up toward $77,000, where the largest bid of around $8 million is positioned, with additional strong support at $77,500, $76,500, and $76,000. The effective trading range is therefore now roughly $77,000-$82,000, with the immediate battle taking place around $79,000-$80,000.
At the same time, overall spot-market depth currently looks roughly balanced: large orders are clustered on both the bid and ask sides. This is the picture of a balanced, two-sided market in which whales are defending both boundaries of the range - a classic compression setup ahead of a breakout rather than one-directional pressure. The outcome will most likely be determined by the macro data released toward the end of the week.
What to Watch Next
The coming days are likely to remain in wait-and-see mode, with the market looking for confirmation. Today, September 9, the Treasury's bond buyback program launches, which we discussed previously, and it should become clearer how the program is being financed and whether it will provide genuine liquidity to the market.
This will be followed by key inflation releases: August PPI on September 10 and, more importantly, August CPI on September 11. The key point here is the market's expectations. After the strong labor-market report, investors are already prepared for a hawkish Fed, so a merely “decent” CPI print may not be enough to trigger a major market sell-off - part of this scenario is already priced in.
The more dangerous outcome would be a combination of oil remaining around or above $100, CPI confirming renewed inflationary pressure, and Treasury yields staying above 4.8%. In that case, markets would have to reassess not only the September meeting but the entire rate path for the coming months, potentially triggering a deeper risk-off move. The FOMC meeting itself is scheduled for September 15-16.
On the crypto side, we will be watching spot behavior relative to futures, the strength of the $77,000 support and the $82,000 sell wall, changes in open interest, and whether the strong inflows into spot BTC ETFs continue.
Analyst Opinion: Constructive Flows Meet a Coiled Macro Risk
Current view: Neutral, but with a clear respect for macro risk. The crypto picture has improved: record spot BTC ETF inflows, gains across altcoins, a partial deleveraging, and whale support moving up toward $77,000. However, all of this is running into a busy and potentially hawkish macro calendar, while balanced market depth suggests that the market is waiting for a trigger rather than establishing a clear direction.
Rationale: In favor of the bulls - $858.8 million in ETF inflows, healthier market structure following the deleveraging, and strong bids around $77,000. Against - declining CVD and neutral-to-negative spot delta, heavy supply at $80,000-$82,000, oil around $100, Treasury yields near 4.8%, and greed at 73 as the price approaches the upper end of the range.
Confirmation level: Absorption of the $80,000-$82,000 sell wall while ETF inflows remain strong and CPI comes in soft would confirm an upside resolution of the range and an attempt to retest the local highs.
Invalidation: A “hot” CPI combined with oil around $100 and yields above 4.8% could trigger a reassessment of the entire rate path and lead to deeper de-risking. A break below $77,000 would open the way lower.
Trading takeaway: Ahead of Friday's CPI, the priority is risk management and confirmation signals rather than taking a directional bet. Key levels are $77,000 support on pullbacks and the $82,000 sell wall on the upside, along with the market's reaction to the September 10 and 11 releases.
Scenarios for the Week Ahead
Neutral scenario. Bitcoin consolidates within the $77,000-$82,000 range ahead of CPI and the Fed meeting. Whales defend both boundaries, ETF inflows continue to support the price, and without a strong catalyst, the market remains in equilibrium.
Downside scenario. A “hot” CPI confirms accelerating inflation, oil remains around $100, and Treasury yields move higher, forcing markets to reassess the entire rate path. A break below $77,000 triggers deeper de-risking and pushes Bitcoin toward lower demand zones.
Upside scenario. CPI data comes in soft or in line with expectations, bond buying provides real liquidity, ETF inflows persist, and spot buying returns. Bitcoin absorbs the $82,000 wall and attempts to set new highs, while altcoins continue to outperform.
In Focus: DeFi Yields vs Treasuries - Where the Money Earns More, and What the Fed Changes
Chart: DeFi Yields vs Treasuries
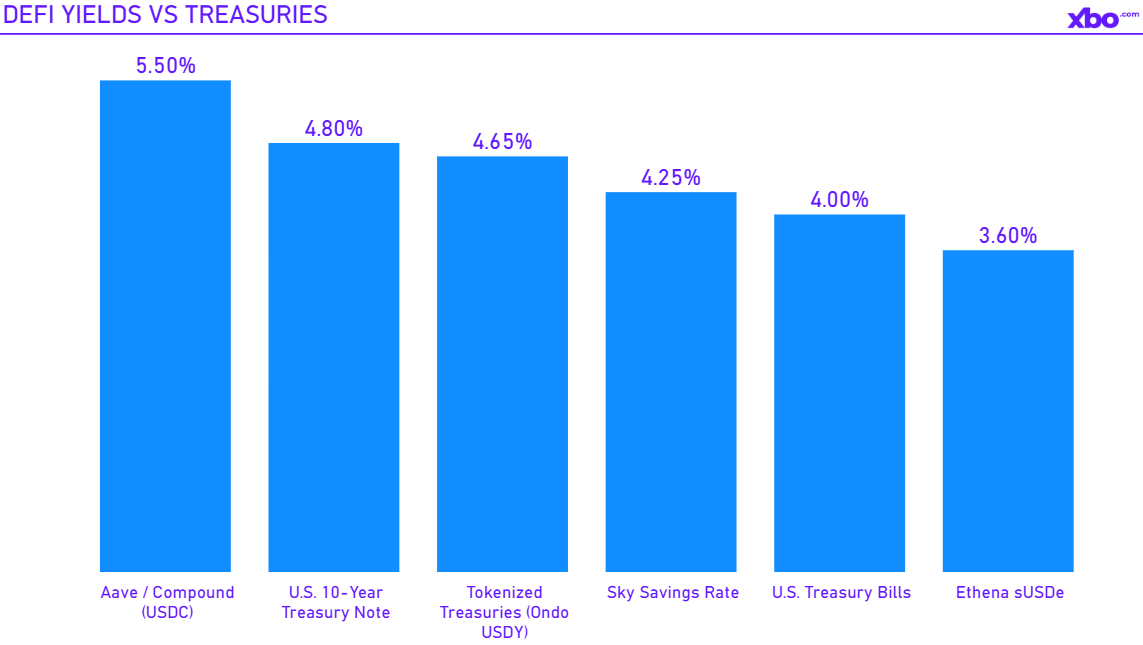
Chart source: DeFiLlama, rwa.xyz, U.S. Treasury
Asset/market: DeFi stablecoin yields vs U.S. Treasury yields
Timeframe: current
Metric: DeFi lending APY, tokenized-Treasury yield, T-bill and 10Y yields
Data checked: September 10, 2026, 09:00 UTC
The question of “where is it more attractive to keep money right now - in DeFi or government bonds?” has become particularly relevant ahead of the September 15-16 FOMC meeting, with the market pricing a more than 60% probability of a rate hike. To answer it, it is important to understand the fundamental difference: government bond yields are set by the Fed, while DeFi yields are generated internally by the crypto market - by demand for borrowing to support leverage. In essence, government bonds establish the “floor,” while DeFi pays a premium above it in exchange for taking on real risk.
Where rates stand today. The risk-free benchmark - short-term U.S. government bonds - is currently around 4%, while 10-year yields remain near 4.8%. DeFi offers a broader and more dynamic range: USDC lending rates on Aave and Compound fluctuate roughly between 3% and 8%, depending on pool utilization; the Sky Savings Rate is around 4-4.5%; while the yield on Ethena’s “synthetic” sUSDe has fallen to approximately 3.6%, down from peaks above 20% in the past. More aggressive strategies - leverage, Pendle, and basis trades - can generate 8-15% or more, but at a significantly higher risk.
A separate category is tokenized government bonds, and this is currently the fastest-growing segment. This is essentially the risk-free rate brought onto the blockchain: the tokenized Treasury market has surpassed $15 billion, BlackRock’s BUIDL fund holds around $3 billion, while products such as Ondo USDY offer roughly 4.65% annualized yield. In essence, this is a bridge between the two worlds - government bond yields combined with on-chain liquidity, which is precisely the RWA boom we discussed in a separate report.
Where is it more attractive right now - adjusted for risk? If we compare like for like, risk-free on-chain yields - tokenized T-bills at around 4-4.65% - are currently quite competitive with DeFi lending at around 4-6%, which carries additional smart-contract and protocol risk at a comparable rate. Higher DeFi yields still exist, but they compensate investors for taking on real risk rather than representing a “free lunch.” In other words, in the current relatively calm environment, the risk-adjusted advantage lies with the risk-free rate and tokenized government bonds. The DeFi premium becomes truly attractive only during a crypto rally, when demand for leverage surges and borrowing rates move materially above the “floor.”
What changes with a Fed rate hike. A rate hike raises this “floor”: short-term government bonds and tokenized T-bills become more attractive, while the hurdle that DeFi must clear becomes higher. This creates an additional incentive to move capital toward risk-free on-chain yields. Duration is also important here: when rates rise, the prices of long-duration bonds decline. Therefore, in a rate-hike scenario, short-duration instruments - T-bills, tokenized money-market funds, and floating-rate DeFi lending - are safer than longer-dated bonds. There is another important link: if a rate hike triggers crypto risk-off and deleveraging, demand for borrowing will decline, causing DeFi rates to compress further. In other words, a hawkish Fed hits DeFi yields from both sides.
Outlook. The structural trend is clear: the risk-free rate is moving onto the blockchain and becoming the base layer of yield in crypto. The tokenized government bond market has grown from less than $1 billion two years ago to more than $15 billion, and as long as rates remain high, this segment should continue to thrive - offering attractive risk-free yield combined with on-chain composability. At the same time, convergence is underway: DeFi itself is increasingly incorporating real-world assets. Ethena, for example, has reduced the share of futures-based collateral and added corporate credit and short-term securities, while Sky uses RWA collateral. In other words, the boundary between “DeFi yield” and “TradFi yield” is gradually disappearing.
Risks - on both sides. In DeFi, these include smart-contract exploits, stablecoin depegs, liquidation cascades, protocol governance risk, and, most importantly, variability: a high yield today does not guarantee the same yield tomorrow. Basis products such as Ethena are also dependent on funding rates, which can collapse. Government bonds have no nominal credit risk, but they carry duration risk - long-dated bonds lose value when rates rise. To use them on-chain, investors also need a tokenized wrapper, which introduces additional issuer, custodian, and regulatory risks.
Practical takeaway. In the current environment - high risk-free rates, a hawkish Fed, and an expected rate hike - “defensive” capital logically gravitates toward short-duration risk-free instruments and their on-chain equivalents in the form of tokenized government bonds. The DeFi premium, meanwhile, should be viewed as compensation for taking a specific risk rather than as a given.
Risks for the Week Ahead
- “Hot” CPI on September 11 combined with oil around $100 and yields above 4.8% - the main risk that could force markets to reassess not only the September meeting but the entire rate path.
- A hawkish Fed. A roughly 55-60% probability of a rate hike, against the backdrop of a strong labor market and inflation above target, is weighing on risk assets.
- Lack of safe-haven demand for bonds. Yields around 4.8% while equities are declining indicate that the market is worried about inflation rather than recession - a risk-off environment without the usual bond cushion.
- Iran and oil around $100 as a source of persistent inflationary pressure.
- Greed at 70 near the upper end of the range - a contrarian signal that often precedes a pullback.
- The Treasury buyback mechanism. If the program is financed through bill issuance, it will not provide a genuine liquidity injection.
The main short-term risk is the combination of a “hot” CPI print, oil around $100, and rising yields, which could shift the market’s focus from a single Fed meeting to the entire rate path.
Watchlist for the Week
- Treasury bond buybacks: launch on September 9 and the financing mechanism.
- Inflation: August PPI on September 10; August CPI on September 11.
- Fed meeting: September 15-16; probability of a rate hike around 55-60%.
- BTC levels: $77,000 support and the $76,000-$77,500 support zone; $80,000-$82,000 overhead supply wall.
- Spot vs. futures and open interest: whether spot demand returns and whether leverage starts building again.
- ETF flows: whether strong inflows into Bitcoin funds continue.
- Brent oil and U.S. Treasury yields: as sources of inflationary and risk-off pressure.
Final Takeaway
Bitcoin rose to around $78,000 over the week, with record spot BTC ETF inflows serving as the main driver and outweighing the challenging external backdrop. The market structure has improved: the attempt to break through $82,000 was rejected, but overheated leverage was partially unwound, while whale support moved up toward $77,000. At the same time, spot momentum remains weak and market depth is balanced, pointing to compression ahead of a breakout.
The macro backdrop remains dangerous by nature: a strong labor market, oil around $100, and yields near 4.8% are creating a “hawkish growth scare” in which both risk assets and bonds are under pressure. The key resolution point will be Friday’s CPI. A merely “decent” report is already partially priced in, but confirmation of accelerating inflation against the backdrop of elevated oil prices could trigger a reassessment of the entire rate path and deeper de-risking.
Until then, the priority is to hold $77,000, monitor ETF inflows, and manage risk ahead of the key data releases.