

Weekly Crypto Market Update: Bitcoin Defends $75K Through a Hawkish Fed Hike as the CLARITY Act Stalls - September 17, 2026

Analyst Summary
Since September 10, Bitcoin has declined by approximately 2.1% and is trading around $76,500, while ETH has lost around 0.8% and is trading near $2,450. The altcoin market capitalization has fallen by 2.5%. Sentiment has cooled within greed territory, with the index currently at 64 points. The week was marked by hawkish pressure: hot August inflation (+3.4% YoY), the failure of the procedural vote on the CLARITY Act in the Senate and, most importantly, the Fed meeting on September 16, at which the rate was unanimously raised by 25 bps to the upper bound of 4.00%. The updated dot plot also signaled another rate hike in 2026 and a higher rate path for 2027. Rising oil prices and a reversal in flows added to the pressure: around $882 million flowed out of spot Bitcoin ETFs over the week, while Ethereum ETFs saw approximately $57 million in outflows. The key signal of the week was resilience: despite the hawkish outcome of the meeting, Bitcoin held the $75,000 zone and even rebounded toward $76,500, as rate expectations had already been priced in. Essentially, the downside scenario we warned about last week materialized, but the market reaction was notably more contained than a deep risk-off move.
Key Market Snapshot
|
Asset |
7D Change |
Trend |
Analyst Bias |
|---|---|---|---|
|
-2.1% |
Down within range, held support |
Neutral |
|
|
-0.8% |
Down, relative strength |
Neutral |
|
|
Altcoins (TOTAL3ES on Tradingview) |
-2.5% |
Down, mild outperformance |
Neutral |
Last Week's Watchlist: What Happened?
- Treasury bond buybacks (launched on September 9, funding mechanism): the program was expanded, with the limit for long-duration operations doubled on September 9. It is financed through the issuance of short-term bills, meaning it does not create new liquidity in the traditional sense.
- Inflation (PPI on September 10, CPI on September 11): CPI came in hot at +3.4% YoY. The dangerous combination we discussed - hot CPI, oil near $100 and elevated yields - largely materialized.
- Fed meeting (September 15-16): the rate was raised by 25 bps to 4.00% in a unanimous 12-0 vote, while the dot plot priced in another hike by the end of the year. The hawkish scenario was confirmed and even intensified.
- BTC levels ($77,000 support / $80,000-$82,000 sell wall): the $77,000 support level failed, with demand shifting lower toward $75,000, which held during the Fed test. The $80,000-$82,000 sell wall remained untouched.
- Spot vs. futures and open interest: organic spot demand remained weak, with CVD making new local lows, while leverage returned. Open interest increased from approximately 105K to approximately 108K BTC.
- ETF flows: the divergence sharply reversed against Bitcoin. Instead of strong inflows, Bitcoin ETFs recorded significant outflows, while flows into ETH ETFs also turned negative.
- Oil and yields: oil rose again, while the 10-year Treasury yield held near 5%, with risk-off pressure becoming evident.
What Moved the Market This Week?
The main event was the Fed meeting. On September 16, the Committee unanimously (12-0) raised the rate by 25 bps, bringing the upper bound of the target range to 4.00%. But more important than the hike itself was the tone: the statement emphasized that the economy is growing at a solid pace, productivity remains strong, capital investment is high, and inflation is still elevated, with the decision aimed at bringing it back toward the 2% target more quickly. The updated dot plot sounded even more hawkish: the median rate for the end of 2026 was raised from 3.8% to 4.1%, implying another hike by year-end, while the 2027 median was raised from 3.6% to 4.1%. In other words, the Fed not only raised rates but also signaled a higher rate path for years ahead. This raises the risk-free discount rate and weighs on risk assets - a continuation of the same hawkish “growth scare” we discussed, with oil rising and 10-year yields near 5%.
Two crypto-specific factors were added to the macro picture. The first was a reversal in ETF flows: around $882 million flowed out of spot Bitcoin ETFs over the week, following strong inflows previously, pointing to reduced risk exposure among some institutional investors. ETH ETFs also recorded outflows, although they were relatively small at $57 million.
The second factor was a regulatory setback. The procedural vote on the CLARITY Act failed in the Senate: 60 votes in favor were required to begin debate, but that threshold was not reached. Formally, the bill remains on the Senate calendar, but the next window for another vote is likely to shift, potentially to a period after November 3, 2026. One of the anticipated bullish catalysts has temporarily been removed from the agenda.
And yet, the key takeaway from the week is resilience. The market reduced risk ahead of time, on September 15, and when the hawkish decision came on the 16th, Bitcoin did not break down but held $75,000 and rebounded toward $76,500. The logic is straightforward: if BTC does not break down even after a hawkish Fed meeting and the failure of the procedural vote, it suggests a genuinely strong market - in that case, the CLARITY Act will quickly fade from focus and attention will shift toward finding new catalysts.
Market Structure: Compression Between Heavy Supply and Stacked Bids
Chart: BTC Market Data
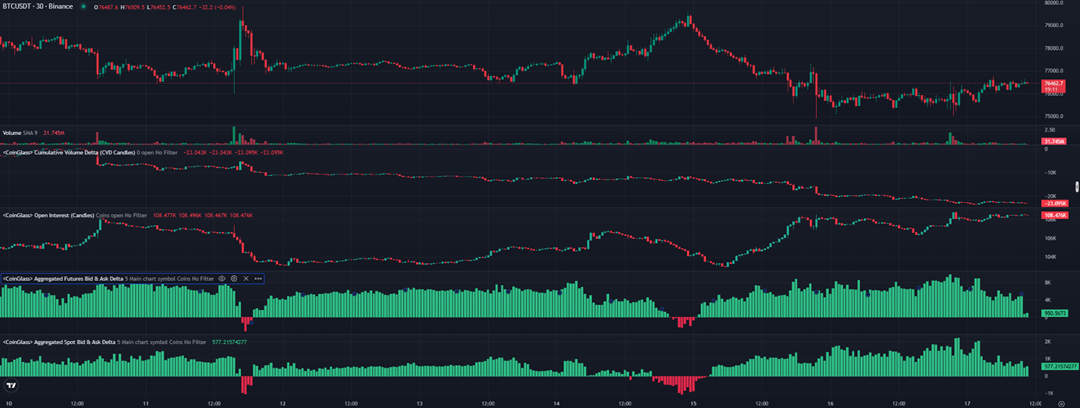
Chart source: CoinGlass
Asset: BTC/USDT
Timeframe: 30 Minutes
Metric: Price, Volume, Cumulative Volume Delta, Open Interest, aggregated futures and spot bid/ask delta
Data checked: September 17, 2026, 9:00 UTC
The structure of the week is best described by the word “compression.” Cumulative volume delta (CVD) declined throughout the period and made new local lows. At the same time, open interest did not decline but increased from ~105K to ~108K BTC: leverage was actively returning to the market, increasing the risk of sharp moves. The end of the week was particularly telling: during the decline toward $75,000 on September 15-16, and then immediately after the Fed decision, both aggregate futures and spot delta remained positive, while the price rebounded toward $76,500. This points to a return of dip-buying demand and an attempt at a local reversal after the event risk surrounding the meeting had passed.
The large-order map helps explain where the boundaries lie. The entire range shifted lower along with the price. The nearest supply is concentrated directly above the market - a dense block around $76,600, followed by $78,000 and then a heavier layer in the $79,200-$80,000 zone. Strong support is stacked below, around $75,000, $74,000, and $73,000. Order-book depth on centralized exchanges appears balanced on both sides, with whales defending both boundaries. This is a compression setup - the effective range has narrowed to approximately $75,000-$78,000, with the nearest battle taking place around $76,500.
What to Watch Next
The event risk around the Fed meeting has passed, and over the coming days the market will be digesting not so much the rate hike itself as the higher rate trajectory. The dot plot has priced in another hike by year-end, shifting the focus toward when it will happen - October or December - and how this will affect expectations. The key technical test is holding $75,000, which has already withstood the Fed meeting: a move above $76,500 and then $78,000 would bring the $79,200-$80,000 zone back into focus, while a break below $75,000 would open the way toward bids at $74,000 and $73,000. We will also be watching Bitcoin ETF flows closely (an end to the outflows would be an early sign of returning demand), open-interest dynamics (leverage returning toward ~108K increases volatility), and oil and yields as sources of inflationary pressure.
Analyst Opinion: A Market Under Pressure, but Not in Panic
Current view: Neutral, with cautious respect for the market’s resilience. Bitcoin is compressing between $76,400-$80,000 in overhead supply and the $73,000-$75,000 bid zone, but holding $75,000 through a hawkish Fed meeting is a notable positive.
Rationale: Against the bulls are CVD at local lows, Bitcoin ETF outflows, a hawkish dot plot, and returning leverage. Supporting the bulls are a decline of just 2.1% despite three negative factors, the defense of $75,000 at the time of the Fed decision, and the shift in both spot and futures delta into positive territory during the rebound. This is a market under pressure, but not in panic.
Confirmation level: A daily close above $78,000 would shift the balance toward buyers - especially if ETF outflows stop at the same time.
Invalidation: A daily close below $75,000 would open a move toward $74,000 and $73,000, where the largest bids are positioned.
Trading takeaway: This is a compression phase, not a trend. It is more rational to wait for a clear breakout from the range ($75,000 to the downside or $78,000 to the upside) rather than anticipate the direction from within it. The return of leverage in a thin market increases the risk of sharp moves in both directions, so risk management should take priority over chasing the move.
Scenarios for the Week Ahead
Neutral scenario. The market digests the hawkish outcome of the meeting without a new catalyst, while $75,000 continues to hold. Bitcoin consolidates in the $75,000-$78,000 range, CVD gradually stabilizes, and whales defend both boundaries. This would be the most likely short-term outcome.
Downside scenario. Accelerating inflation and rising oil prices reinforce expectations of a more aggressive rate hike at the next meeting, pushing yields higher. A break below $75,000 triggers a move toward bids at $74,000 and $73,000, and if those levels fail, a deeper pullback and liquidation of the returning leverage could follow.
Upside scenario. $75,000 holds, the rebound continues, the market reclaims $76,500 and $78,000, ETF outflows slow, and the CLARITY Act setback ultimately fades from focus. Bitcoin tests the $79,200-$80,000 zone, confirming the thesis of a genuinely strong market, while altcoins continue to outperform.
In Focus: The Treasury's Bond Buybacks - Debt Management, Not a Liquidity Faucet
Chart: Overnight Reverse Repurchase Agreements
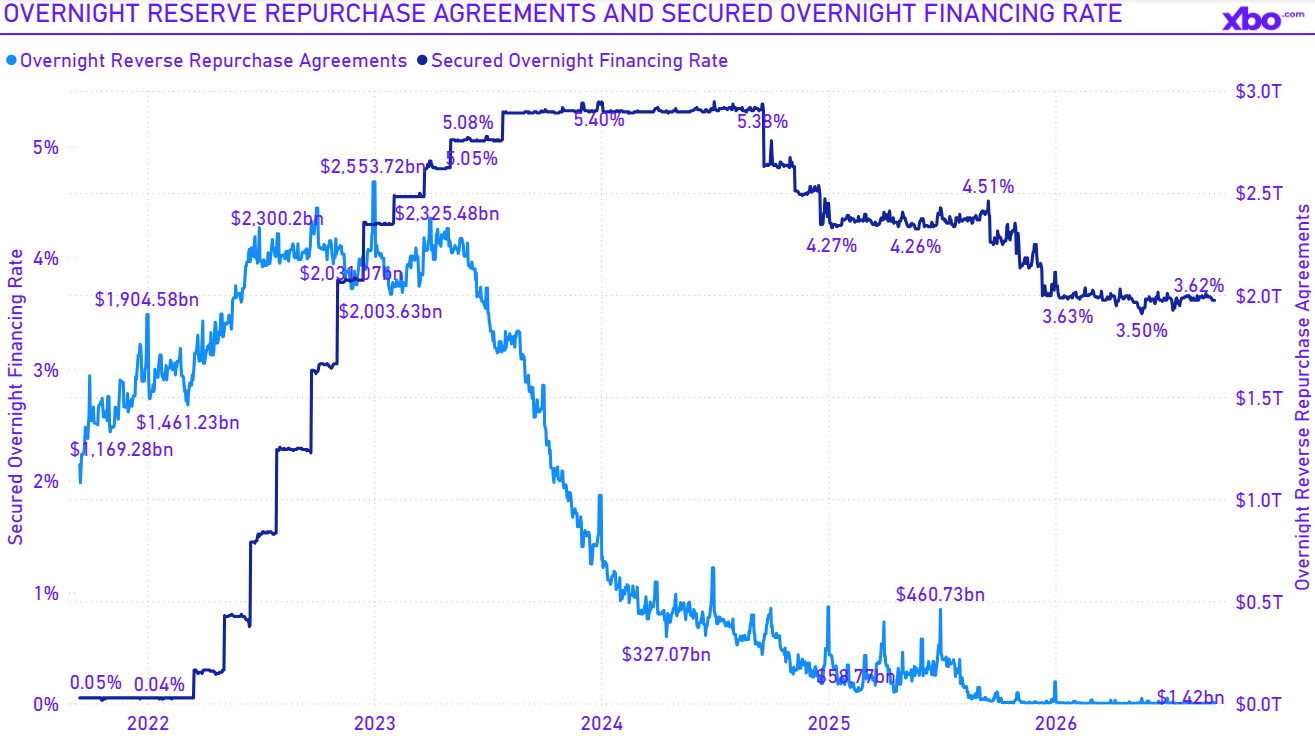
Chart source: Federal Reserve Bank Data
Asset/market: Overnight Reverse Repurchase Agreements, Secured Overnight Financing Rate
Timeframe: Daily
Metric: ON RRP balance, SOFR
Data checked: September 17, 2026, 9:00 UTC
This week, two seemingly contradictory narratives converged. On the one hand, August inflation (September 11) and the Fed meeting (September 16): prices rose 0.4% month-on-month and 3.4% year-on-year, while core inflation increased 0.3% MoM, above expectations. The Fed then raised its policy rate by 25 bps to 4.00% and lifted the median dot-plot projection, pricing in another hike in 2026. The 10-year Treasury yield approached 5% for the first time since 2024. On the other hand, a week earlier, on September 9, the U.S. Treasury expanded its long-term bond buyback program. Let’s break down how this mechanism works, what it does to the debt, and whether it adds liquidity to markets, including crypto.
Inflation and the Fed push rates higher - but not evenly across the curve
It is important to distinguish between two parts of the yield curve. Short-term securities - Treasury bills (T-bills) - track the Fed policy rate: when the central bank hikes rates and signals further moves, their yields rise almost mechanically. The September 16 meeting reinforced this dynamic: the Fed not only raised rates but also increased the median dot-plot projection for the end of 2026 from 3.8% to 4.1%, and for 2027 from 3.6% to 4.1%. In other words, short-term rates will remain higher for longer, and T-bill yields will follow.
The long end (10-30 years) responds to inflation expectations and the term premium, and this is where the pressure has been most pronounced: the 30-year yield at auction reached 5.216%, its highest level since 2001. The problem for the Treasury is that elevated long-term yields increase the cost of servicing future debt. This is where the buyback program comes in: by purchasing long-dated bonds, the Treasury is attempting to support the part of the curve that the Fed does not directly control.
How the Treasury’s mechanism works
On September 9, the Treasury increased the maximum size of a single buyback operation in the two longest maturity buckets (10-20 and 20-30 years) from $2 billion to at least $4 billion per operation, with the change effective through early November. This is a limit per session, not the size of the entire program: buybacks take place roughly once a week and rotate across different parts of the curve, from 1-2 years to inflation-protected TIPS, with lower maximums for shorter-maturity buckets.
As a result, the aggregate volume is more modest than it might initially appear: the fall schedule includes 11 operations from September 10 to November 12, totaling approximately $26 billion across all maturity buckets, or around $2.4 billion per operation on average. For the full year 2026, there will be 57 operations versus 41 in 2025, while there were only 17 in total across the 22 years from 2002 to 2023. This is not a one-off intervention, but a sharp expansion of a relatively young program that has already become routine.
The reason for the expansion is chronic excess supply. Under the previous $2 billion per-operation limit, the 10-20-year bucket had a cumulative buyback limit of $6 billion across three sessions, while dealers submitted approximately $50.4 billion in offers. In the 20-30-year segment, the limit was $8 billion across four operations versus approximately $95.1 billion in offers. In other words, sellers looking to offload long-dated bonds outnumbered the Treasury’s available buyback capacity by roughly 8-12 times. This imbalance prompted the increase in operation sizes. It also indicates that participants have accumulated substantial inventories in the less liquid long-duration segment, leaving the program with significant room to absorb additional supply.
The key point is the funding source. The Treasury finances the buybacks not with “new money,” but through its existing cash balance and the issuance of new short-term bills. In other words, it retires a long-dated bond while issuing a T-bill at the same time. According to the Treasury’s official framing, the program is neutral to the overall debt structure, but the practical direction is clear: buy long, borrow short.
What does this do to U.S. debt?
The main misconception needs to be addressed first: buybacks do not reduce government debt. One security is retired and another is issued, so the aggregate amount of debt remains broadly unchanged. This is a refinancing and liquidity-management operation, not a reduction in liabilities.
What does change is the average maturity of the debt: it becomes shorter because long-dated securities are replaced with short-term bills. There is a cost to this. Short-term debt needs to be refinanced more frequently and is more sensitive to the Fed policy rate. And as the September 16 meeting showed, rates are rising and, judging by the dot plot, are likely to rise further. In other words, by easing pressure on the long end today, the Treasury increases the sensitivity of its debt portfolio to short-term rates precisely when those rates are moving higher. It is a trade-off, not a free lunch.
Does this add liquidity to markets and crypto?
The short answer is: not in the way QE adds liquidity. This distinction is critical.
Quantitative easing is conducted by the Fed: it creates new bank reserves, expands its balance sheet and injects base money into the financial system. The Treasury does not have this capability - it cannot create reserves or expand the Fed’s balance sheet. Mechanically, a buyback resembles QE (it is also a purchase of bonds and also supports their price), but fundamentally it is a debt-management tool rather than a source of new money for the system.
There are, however, three more nuanced effects that explain why risk assets reacted positively to the news:
- Liquidity in the “plumbing,” not the money supply. Buybacks remove long-duration exposure from dealer balance sheets and free up their capital. This improves the functioning of the Treasury and repo markets - in other words, it facilitates market trading mechanics without increasing the amount of money in the system.
- The valuation channel through long-term rates. By putting downward pressure on long-term yields (the 30-year yield fell by approximately 9 bps after the program was expanded), the Treasury lowers the risk-free discount rate that serves as the baseline for valuing equities, crypto and other risk assets. It also reduces competition from bonds for capital - a direct continuation of the theme from our previous piece on DeFi yields versus government bonds: the lower long-term yields are, the less compelling the “sit in Treasuries at 5%” argument becomes.
- An important 2026 nuance. Financing buybacks through bill issuance could add liquidity if the bills were absorbed using the Fed’s reserve buffer (RRP). But the RRP is now close to zero - the cushion is gone. As a result, additional bill issuance now draws funds directly from bank reserves and can, conversely, tighten funding conditions. Tellingly, the Fed itself separately emphasized in its September 16 statement its focus on maintaining an ample level of reserves in the banking system - reserve scarcity is already on its radar.
The takeaway for crypto is straightforward: the expansion of Treasury buybacks is a genuine supportive factor through long-term rates and market mechanics, and it helped the Treasury market absorb the hawkish Fed meeting without a disorderly move at the long end. But calling it “stealth QE” or a new wave of liquidity would be inaccurate. No fresh money is entering the system, and with the Fed raising rates and RRP balances near zero, the net liquidity impact is far from unambiguous. For crypto, this is more about reducing the headwind from long-term rates than providing the tailwind of new liquidity.
Risks for the Week Ahead
- Higher rate path. The dot plot priced in another rate hike in 2026 and a higher level for 2027 - putting more pressure on risk assets than the September move itself.
- Inflationary impulse through oil. Another rise in oil prices and 10-year Treasury yields above 5% could push rate expectations even higher.
- Continued Bitcoin ETF outflows. Persistent institutional risk reduction would weaken demand.
- Regulatory vacuum. The CLARITY Act being put on hold removes a near-term positive catalyst and could weigh on sentiment even if price holds.
- Return of leverage. Rising open interest to ~108K BTC in a thin market increases the risk of sharp moves in both directions.
- Geopolitics. Elevated uncertainty, also highlighted in the Fed’s statement, remains a risk factor for the broader segment.
Watchlist for the Week
- Fed trajectory: timing of the next rate hike (October or December) and how expectations react to the updated dot plot.
- BTC levels: $75,000 support, $73,000-$74,000 bid zone; resistance at $76,600, $78,000, and the $79,200-$80,000 range.
- Spot vs. futures and open interest: whether the recovery in spot demand holds and whether leverage (~108K BTC) becomes overheated again.
- ETF flows: whether Bitcoin ETF outflows stop and inflows into Ethereum ETF continue.
- Brent oil and U.S. Treasury yields: as sources of inflationary and risk-off pressure.
Final Takeaway
This week was a test of resilience - and the market largely passed it. Bitcoin absorbed hot inflation, a hawkish Fed rate hike to 4.00% with a signal of further moves, rising oil prices, ETF outflows, and the failure of the CLARITY Act, yet declined only 2.1% and defended the $75,000 area, rebounding to $76,500 after the meeting. In effect, the hawkish downside scenario from the previous report materialized, but the reaction was much more contained than a deep risk-off move - an encouraging signal. However, it is still too early to relax: CVD is near local lows, leverage has returned, and the dot plot points to a higher rate path. With price currently compressed between supply around $78,000-$80,000 and dense bids around $73,000-$75,000, direction will be determined by which side of the range the market breaks out of. Resilience can only be confirmed by a move back above $78,000 alongside a stabilization in ETF flows; until then, the priority remains defending $75,000 and managing risk.