


Weekly Crypto Market Update: Bitcoin Defends Its Range Through a BoJ Shock and Stagflation-Tinged U.S. Data - August 6, 2026

Analyst Summary
Bitcoin ended the week virtually unchanged, trading around $64,700. However, price action was far from quiet, with Bitcoin moving across almost the entire range: it first climbed to approximately $65,400 before correcting to $62,300, where buyers once again stepped in and pushed the price back to current levels. Ethereum also finished the week largely unchanged, while the broader altcoin market gained around 1%.
The $63,000-$67,000 trading range remains intact. The week's key developments were the Bank of Japan's record currency intervention on Friday, July 31, which drove USD/JPY sharply lower from 163.8 to 158, and a mixed set of U.S. macroeconomic data: a relatively benign PCE inflation reading, but noticeably weaker GDP growth accompanied by a sharp increase in the GDP deflator.
ETF flows also improved. Last week's outflows reversed into net inflows, with more than $593 million flowing into spot Bitcoin ETFs since July 30, although the inflows were uneven across trading sessions.
Against the backdrop of seasonally thin August liquidity and a narrowing trading range, the risk of further downside remains. However, steady spot demand continues to provide support for the market. The neutral scenario played out as expected.
Key Market Snapshot
|
Asset |
7D Change |
Trend |
Analyst Bias |
|---|---|---|---|
|
+1.5% |
Range |
Neutral |
|
|
+0.4% |
Range |
Cautiously-Bullish |
|
|
Altcoins (TOTAL3ES on Tradingview) |
+1% |
Range |
Neutral |
Last Week's Watchlist: What Happened?
- $63,000-$67,000 Range: The range held. Bitcoin traded across nearly the entire range before returning to around $64,100.
- ETF Flows: The trend reversed back to net inflows, with more than $593 million flowing into spot Bitcoin ETFs since July 30, although the inflows were uneven across trading sessions.
- Big Tech Earnings: Microsoft and Amazon demonstrated that AI investments are beginning to generate tangible returns, and their shares rallied. Meanwhile, Meta, Apple, and Alphabet declined despite raising their AI spending guidance.
- U.S. Q2 GDP: Economic growth slowed to 1.5%, below the 2.1% consensus forecast, while the GDP deflator jumped to 6.3%, significantly above expectations of 4.1%.
- July ISM PMI: Manufacturing data came in slightly stronger than expected, with the S&P Global Manufacturing PMI at 53.9 versus 53.8 expected, and the ISM Manufacturing PMI at 55.6 versus 53.3.
- Oil / Iran / Strait of Hormuz: There was no meaningful progress in negotiations, but oil prices continued to decline, with Brent crude falling to around $78 per barrel.
- Scenario Realized: Neutral.
What Moved the Market This Week?
The week's primary catalyst was macroeconomic policy. On Friday, July 31, the Bank of Japan carried out one of the largest currency interventions in its history, sending USD/JPY sharply lower from 163.8 to 158. At the same time, a series of concerning U.S. economic data-including GDP, inflation, and labor market figures-was released. We discuss these developments in more detail in the second part of this report. As a result, Bitcoin entered a correction and tested support at $62,300, where buyers once again demonstrated their strength.
The market's reaction is clearly reflected in flow data. Since August 4, Bitcoin's cumulative volume delta has been rising while open interest has been declining. This indicates a deleveraging of the futures market, with leveraged long positions being unwound, while buying activity has continued in the spot market. It was this steady spot demand that ultimately held the market at the support level.
Market Structure: A Narrowing Range and the Thinnest Spot Liquidity Since 2019
Chart: Bitcoin Market Data
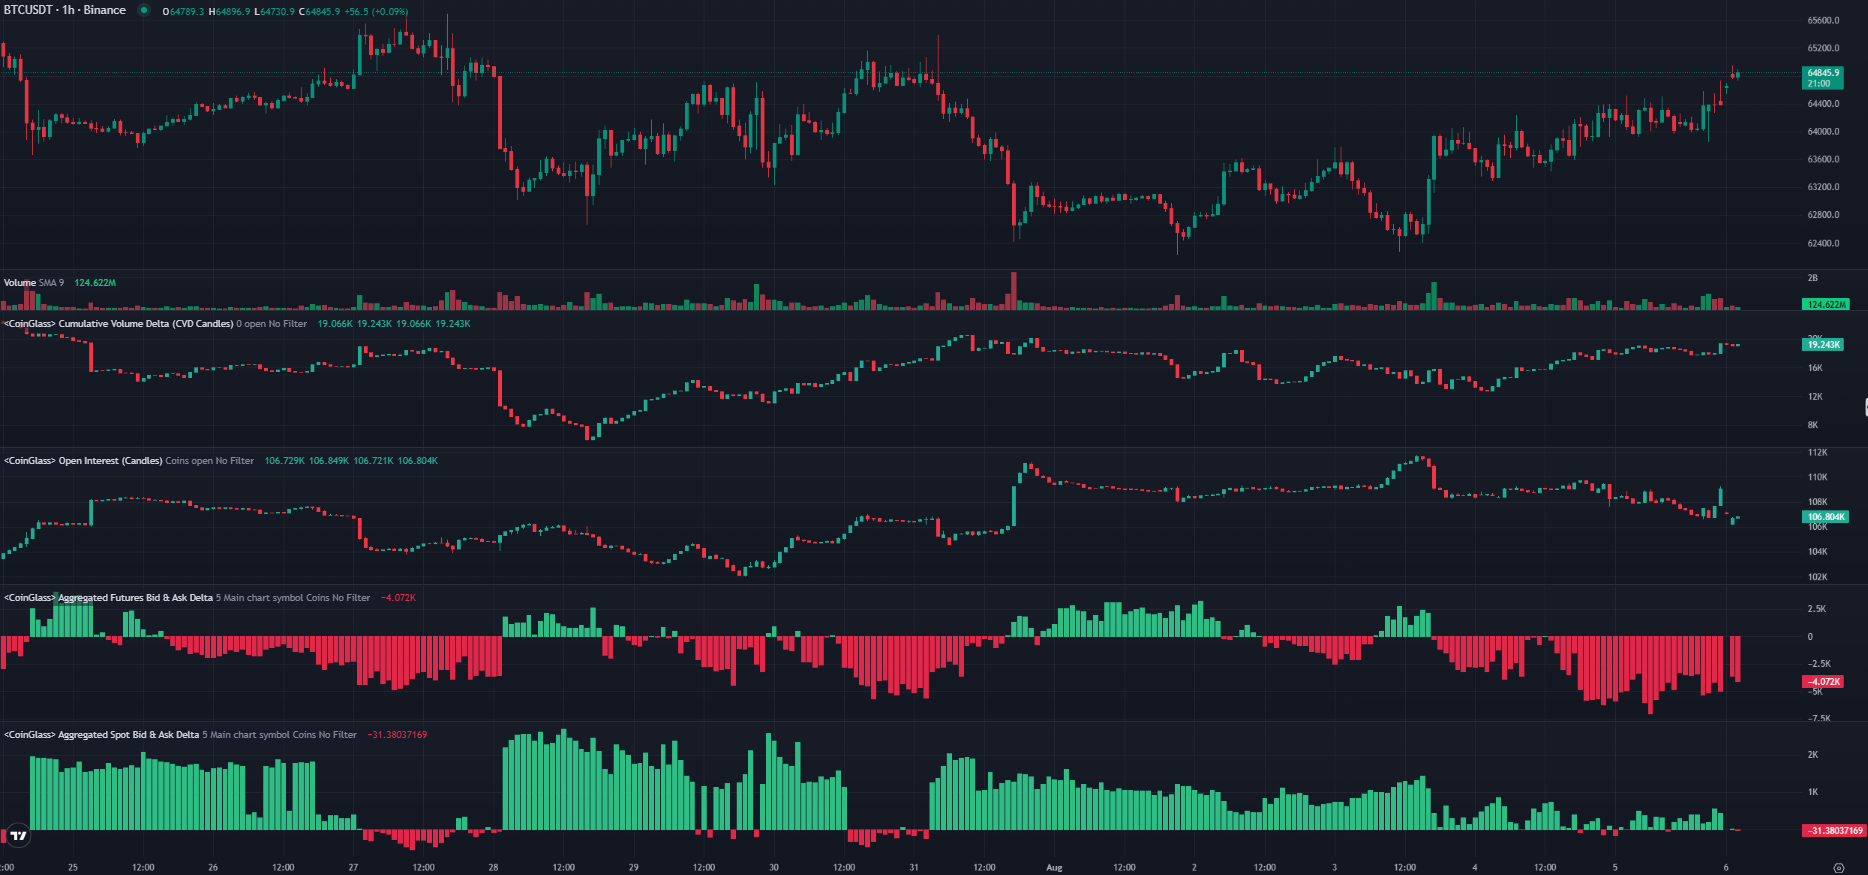
Chart source: CoinGlass
Asset: BTC/USDT
Timeframe: 1 Hour
Metric: Cumulative Volume Delta, Open Interest, aggregated futures and spot bid/ask delta
Data checked: August 6, 2026, 09:00 UTC
The futures order book delta within 5% market depth remains predominantly negative, indicating that short positions continue to dominate. In contrast, the spot order book delta points to stronger buying activity. However, we are seeing the same pattern observed in previous weeks: once Bitcoin moves above $63,800, spot buying activity declines sharply. Until recently, this threshold was above $64,000, indicating that both the trading range and overall market liquidity continue to tighten, as we noted in our previous report.
The broader liquidity backdrop supports this view. August has historically been one of the least active trading months, and Glassnode data shows that spot trading volume across major centralized cryptocurrency exchanges has fallen to its lowest level since 2019.
Spot whales remain active. According to CoinGlass, nearly the entire range from $61,000 to current price levels is supported by buy orders. However, one important change has occurred: the large buy order around $61,300, which we highlighted in previous reports, has been removed. The nearest significant buy wall is now located at $62,000, with more than 117 BTC in resting bids, while the closest notable sell order-approximately 64 BTC-is positioned at $65,000.
Nevertheless, given the narrowing trading range, deteriorating macroeconomic backdrop, and the likelihood of stronger inflation data for July, the risk of a further downside drift remains elevated. The key area to watch is the $62,000-$62,500 support zone. How buyers respond as Bitcoin approaches this range will determine whether underlying spot demand remains strong enough to support the market.
What to Watch Next
The primary focus over the coming days will be U.S. macroeconomic data. On August 7, the market will receive the July U.S. labor market report, including Nonfarm Payrolls, the unemployment rate, and Average Hourly Earnings-key indicators that will shape expectations for future Federal Reserve policy decisions.
Looking further ahead, the July CPI and PPI reports will be released on August 12 and 13, followed by Core Retail Sales and Retail Sales on August 14. Together with the macroeconomic releases scheduled for August and September, these reports will help determine whether July's rise in oil prices has begun to feed into inflation and whether consumer spending is starting to weaken.
Investors should also continue to monitor oil prices, developments surrounding Iran, and progress on the CLARITY Act. Within the crypto market, the key indicators remain unchanged: the strength of spot demand near the lower boundary of the trading range, the buy wall around $62,000, ETF flows, changes in open interest, and the activity of large whale orders.
Analyst Opinion
Current view: The market remains in a neutral scenario with a downside bias. Bitcoin continues to hold its trading range, but the narrowing market, seasonally thin August liquidity, and mixed macroeconomic data increase the risk of a test of the $62,000-$62,500 support zone and potentially lower levels. A weaker U.S. dollar following the Bank of Japan's intervention remains a supportive factor.
Rationale: The underlying demand structure remains intact, with spot buyers continuing to absorb pullbacks and whale buy orders spread across the range from $62,000 upward. At the same time, the futures market is undergoing deleveraging, spot buying activity fades once Bitcoin moves above $63,800, and overall market liquidity has fallen to its lowest level since 2019. Meanwhile, the latest GDP and GDP deflator data point to slowing economic growth alongside rising price pressures. The removal of the large buy order at $61,300 has also weakened the market's support structure.
Confirmation level: A return to sustained ETF inflows and a decisive move above $65,000-where the nearest significant sell-side liquidity is concentrated-would revive the case for an upside breakout from the current range.
Invalidation: A loss of the $62,000 buy wall in an environment of thin liquidity would open the door to a deeper correction. Potential downside catalysts include stronger-than-expected July CPI and PPI inflation data, more hawkish Federal Reserve guidance regarding September, or a renewed escalation in geopolitical tensions.
Trading takeaway: In the seasonally thin August market, the priority remains unchanged: disciplined risk management and confirmation signals should take precedence over directional bets. The key levels to watch are the strength of spot demand in the $62,000-$62,500 support zone during pullbacks and the market's reaction to the major macroeconomic releases on August 7, August 12-13, and August 14.
Scenarios for the Week Ahead
Neutral scenario: Bitcoin remains range-bound, supported by steady spot demand and whale buy orders. The market trades cautiously ahead of key labor market and inflation data, while thin liquidity amplifies price swings within the range.
Downside scenario: Stronger-than-expected July CPI and PPI inflation, weak labor market data, or renewed hawkish signals from the Federal Reserve break the $62,000 buy wall, sending Bitcoin toward lower support levels. The narrowing trading range and ongoing futures deleveraging further amplify the downside move.
Upside scenario: The weaker U.S. dollar following the Bank of Japan's intervention continues to provide support, inflation data comes in softer than expected, ETF inflows accelerate, the CLARITY Act advances, progress is made in negotiations between Iran and the United States, and shipping through the Strait of Hormuz begins to normalize. Under these conditions, Bitcoin establishes support above $65,000 and attempts to test the upper boundary of its current trading range.
In Focus: The BoJ Intervention and Stagflation-Tinged U.S. Data
The Bank of Japan intervened because the yen had weakened excessively. Tokyo's official objectives are clear: to halt the yen's depreciation, reduce imported inflation, and curb the overheating of the carry trade. It is important to understand the mechanics here: a sharp appreciation of the yen puts pressure on carry trades-strategies in which investors borrow cheap yen to purchase other assets, including risk assets. As a result, the intervention initially triggered a risk-off shock, and it was during this move that Bitcoin fell to $62,300.
However, there is another, more constructive side to this story. A controlled weakening of the U.S. dollar is also beneficial for the United States: it improves the competitiveness of American exports, eases financial conditions without requiring the Federal Reserve to cut interest rates, and supports the stock market. At the same time, a weaker U.S. Dollar Index is generally supportive for gold, equities, and cryptocurrencies. In other words, while the intervention caused a short-term sell-off through the unwinding of carry trades, a weaker dollar is supportive for risk assets over the medium term.
At the same time, a new batch of macroeconomic data was released, making the overall picture more mixed. On the one hand, consumer inflation remained relatively subdued: Core PCE slowed to 3.3% year-over-year and 0.1% month-over-month, while headline PCE unexpectedly declined by 0.1% month-over-month in June, despite remaining at 3.7% year-over-year. Initial jobless claims also remained low at 197,000.
On the other hand, the picture for production and the broader economy is more concerning. Second-quarter GDP growth slowed to 1.5%, below the expected 2.1%, while the GDP deflator surged to 6.3%, well above the 4.1% forecast. In other words, the economy is slowing faster than expected, while broad price pressures-particularly at the production level-are accelerating. This may indicate that inflation has become deeply embedded in the production sector but has not yet fully passed through to consumers. Business activity also points in this direction, as it is not only holding up but accelerating: the ISM Manufacturing PMI rose to 55.6, while the S&P Global Services PMI climbed to 54.5 in July from 51.9 a month earlier and above the consensus forecast of 53.6. It is important to note that the weak GDP data reflects the second quarter and is therefore backward-looking, whereas the July PMI surveys provide a more current picture-and they indicate that activity is already strengthening in the third quarter. Strong economic activity combined with accelerating producer prices is not the kind of environment that allows the Federal Reserve to ease monetary policy.
Chart: Revenue Estimates Scorecard
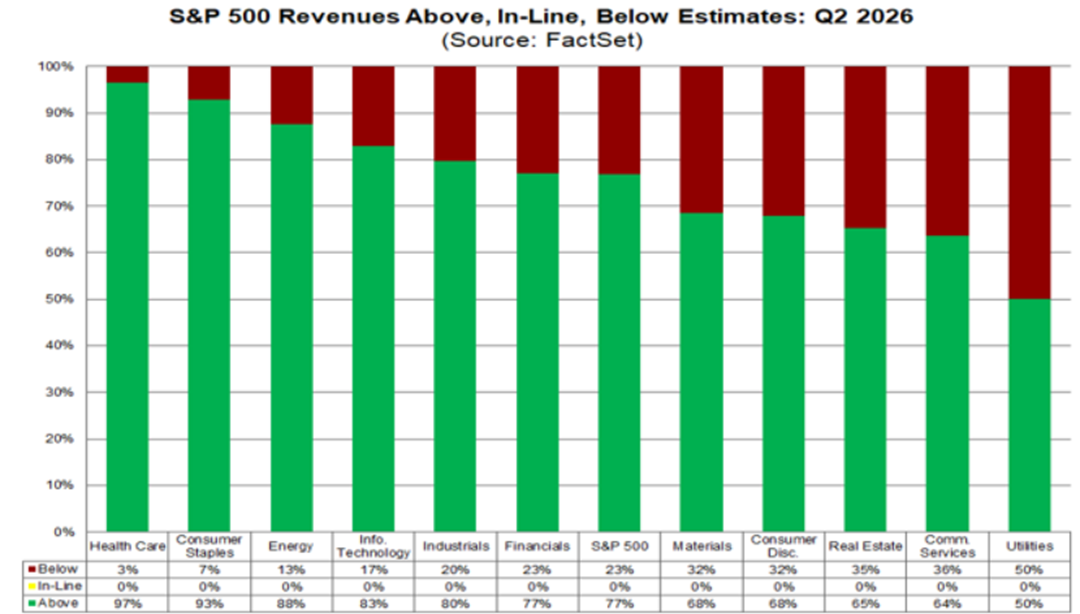
Chart source: FactSet
Metric: Q2 2026 Revenue level fact vs estimates
Data checked: August 6, 2026, 09:00 UTC
This view is further supported by the strong corporate earnings season. According to FactSet, 77% of traded companies that have reported so far have exceeded revenue expectations, compared with the five-year average of 70%, while 86% have beaten earnings-per-share estimates, versus the five-year average of 78%. It is also worth recalling Kevin Warsh's remark that investments in artificial intelligence are driving up infrastructure costs. The surge in the GDP deflator alongside relatively subdued PCE inflation fits well with that narrative.
What does all of this mean for the market? Slowing economic growth combined with accelerating prices creates a stagflationary backdrop, significantly reducing the Federal Reserve's room to ease monetary policy. Based on the current data, the Fed is unlikely to cut interest rates in September, at the very least. The next key developments will come with the CPI and PPI releases on August 12 and 13, followed by Retail Sales on August 14. These reports will show whether producer inflation has begun to pass through to consumers and whether consumer demand is starting to cool. For the crypto market, this is the key macro crossroads of the week: softer inflation data combined with a weaker dollar would support risk appetite, while stronger inflation readings would bring the prospect of a more hawkish Federal Reserve back into focus.
Risks for the Week Ahead
- Strong July inflation in the CPI and PPI releases, confirming that producer inflation is beginning to pass through to consumers.
- A stagflationary signal from the data: slowing GDP growth alongside a 6.3% GDP deflator limits the Federal Reserve's ability to cut interest rates and keeps the risk of a September pause-or even further tightening-alive.
- Secondary effects of the Bank of Japan's intervention: further yen appreciation could accelerate the unwinding of carry trades and trigger another short-term risk-off move.
- A narrowing trading range and seasonally thin August liquidity, with market liquidity at its lowest level since 2019, increasing volatility.
- The removal of the large whale buy order at $61,300 and the risk of losing the $62,000 buy wall.
- A renewed rise in oil prices.
The main short-term risk is a combination of stronger-than-expected inflation and thin market liquidity, leaving the market less able to absorb a negative surprise.
Watchlist for the Week
- U.S. July labor market data: Nonfarm Payrolls, Unemployment Rate, and Average Hourly Earnings - August 7.
- Inflation: CPI - August 12; PPI - August 13.
- Consumer spending: July Core Retail Sales and Retail Sales - August 14.
- USD/JPY and the U.S. Dollar Index: Price action following the Bank of Japan's intervention.
- BTC levels: The $62,000 buy wall and the $62,000-$62,500 demand zone; the nearest significant sell wall at $65,000.
- Spot BTC and ETH ETF flows: Continued inflows as confirmation of resilient demand.
- Open interest and order book delta: Whether futures deleveraging continues alongside ongoing spot buying.
- Brent crude and Iran: A renewed rise in oil prices or a continuation of the current correction.
- CLARITY Act: Progress on the U.S. crypto market structure legislation.
Final Takeaway
Bitcoin traded within its range throughout the week and returned to $64,100, maintaining its market structure despite the Bank of Japan's record intervention and mixed macroeconomic data. The intervention created short-term pressure on risk assets through the unwinding of carry trades, pushing Bitcoin down to $62,300, but spot demand stepped in again at those levels, while a weaker dollar remains a medium-term tailwind for crypto.
At the same time, economic data remains contradictory: consumer PCE inflation is relatively calm, but slowing GDP growth combined with a 6.3% GDP deflator points to a stagflationary backdrop and suggests that inflation is becoming more entrenched in the production sector. This reduces the likelihood of a Federal Reserve rate cut in September.
Against the backdrop of a narrowing trading range and the lowest liquidity environment since 2019, the risk of further downside remains elevated. The key market drivers will be the upcoming labor market and inflation releases on August 7, August 12-13, and August 14. For now, spot demand continues to support the market, but until there is greater clarity on inflation, confirmation signals and risk management remain the priority.
Methodology
This weekly update analyzes crypto market structure, technical indicators, liquidity and market depth, derivatives positioning, options and liquidation data, on-chain activity, and market sentiment alongside asset price performance. It also incorporates relevant macroeconomic, corporate, and regulatory developments. The analysis is based on information available at the time of publication and may change as new market data emerges.
Disclaimer
This report is provided for educational and informational purposes only and should not be considered financial, investment, or trading advice. Cryptocurrency markets are highly volatile, and past performance is not indicative of future results. Always conduct your own research and carefully assess your risk tolerance before making any investment or trading decisions.



.png)