

Weekly Crypto Market Update: Bitcoin Grinds in a Tightening Range as Soft Inflation Meets a Growth Scare - August 13, 2026

Analyst Summary
Bitcoin continues to trade within a narrowing range and is currently around $63,600, remaining within the $63,000-$67,000 range. Notably, bitcoin declined following the release of July CPI data on August 12, despite the inflation reading coming in softer than expected. Market sentiment remains at 38 points, firmly in fear territory.
The main theme this week was once again the macro backdrop: a shockingly weak July labor market report and softer-than-expected CPI data were both disinflationary and are likely to revive expectations of Fed easing, which is supportive for risk assets over the medium term. However, bitcoin's reaction has remained muted, while inflows into spot ETFs have slowed sharply, totaling just around $26.5 million over the week versus nearly $350 million in the previous period. This suggests that the market is weighing not only the positive implications of disinflation, but also the signal of a slowing economy. The neutral scenario has played out, while the trading range continues to tighten.
Key Market Snapshot
|
Asset |
7D Change |
Trend |
Analyst Bias |
|---|---|---|---|
|
-1.36% |
Range |
Neutral |
|
|
-0.75% |
Range |
Cautiously-Bullish |
|
|
Altcoins (TOTAL3ES on Tradingview) |
+0.42% |
Range |
Neutral |
Last Week's Watchlist: What Happened?
- US labor market for July (August 7): came in significantly weaker than expected - nonfarm payrolls fell by 23,000 versus expectations for an increase of 85,000.
- July CPI (August 12): came in softer than expected, with headline CPI rising just 0.1% month-on-month and core CPI increasing 0.2%.
- $62,000 order block: held - moreover, buying demand moved higher into the $62,500-$63,500 zone.
- ETF flows: inflows continued but slowed sharply, reaching around $87.8 million for the week versus nearly $350 million previously.
- Open interest and delta: during the correction, futures selling increased as open interest rose, while spot delta remained positive.
- Scenario realized: neutral; the range held.
What Moved the Bitcoin Market This Week?
The week was once again dominated by macroeconomic data, but the tone shifted. On August 7, the US labor market report came in unexpectedly weak, followed by a softer-than-expected July CPI release on August 12. Both reports were disinflationary and are likely to bring the prospect of Fed policy easing back into focus.
More important, however, was the market's reaction. Despite the disinflationary data, bitcoin failed to rally and instead corrected toward $63,600 following the CPI release. This is a classic case of “buy the rumor, sell the news,” but there is a deeper reason behind the reaction: the market is now weighing not only the decline in inflation but also the sharp deterioration in the labor market. When employment declines in absolute terms, weak data are no longer interpreted purely as a positive signal that “the Fed will ease” and instead begin to be viewed as evidence of a broader economic slowdown. The sharp slowdown in spot ETF inflows further confirms the market's cautious stance.
Market Structure: A Range Tightening From Both Sides
Chart: Bitcoin Market Data
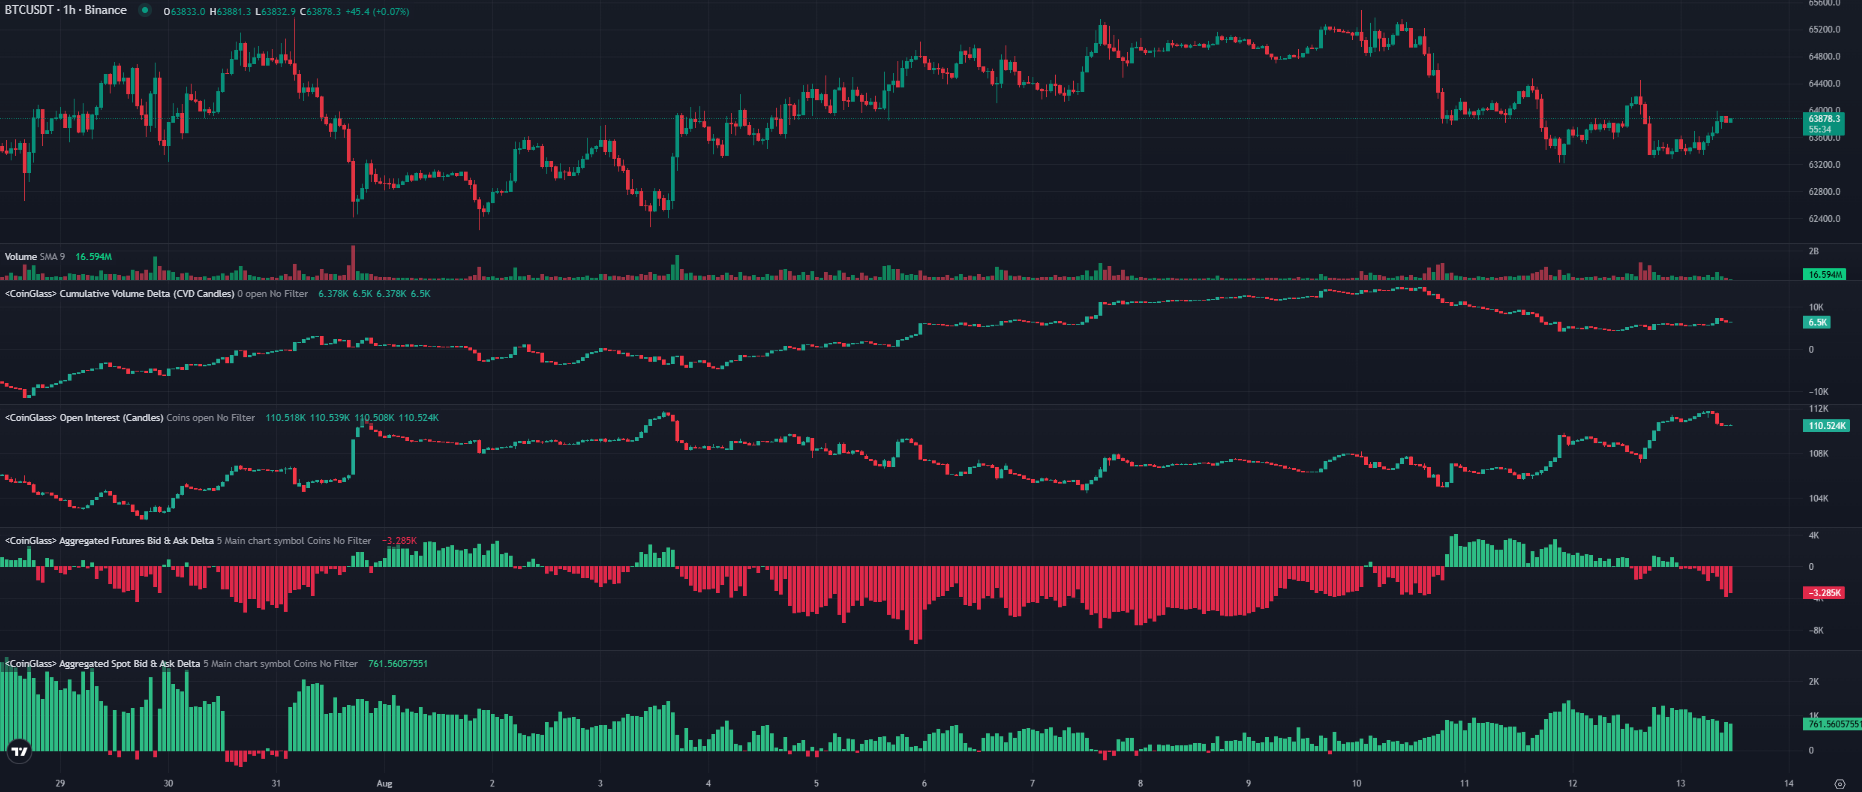
Chart source: CoinGlass
Asset: BTC/USDT
Timeframe: 1H
Metric: Cumulative Volume Delta, Open Interest, Aggregated futures and spot bid/ask delta
Data checked: August 13, 2026, 09:00 UTC
Market structure confirms the familiar pattern, but with some important nuances. Following the post-CPI correction, cumulative volume delta turned lower, while open interest increased - suggesting that fresh short positions in futures contributed to the decline. At the same time, aggregated spot delta at 5% market depth remained positive: spot buyers on centralized crypto exchanges continue to buy the dips, while selling pressure remains dominant in futures. This is the same “spot vs. futures” divergence we highlighted previously - structurally constructive, but tactically vulnerable in the thin August market.
The whale order map on CoinGlass shows that the range is tightening from both sides. In the previous review, we noted that the large $61,300 buy order had been cancelled, with the nearest significant bid at $62,000 and the nearest sell order at $65,000. Over the past week, buyers have moved their bids noticeably higher: the largest buy order is now around $62,500, with a volume of approximately $7 million, while the entire $63,000-$63,500 zone is densely populated with buy orders - including approximately $4.6 million at $63,500, $5.1 million at $63,000, and $3.7 million at $63,393.
The picture on the sell side is the mirror image: supply has moved closer to the current price. The nearest significant sell orders are now concentrated in the $64,150-$65,000 zone, with larger walls appearing only above that level - approximately $4.7 million at $66,000 and $6 million at $67,000. In other words, buyers have moved their bids higher while sellers have moved their offers lower, narrowing the effective trading range to approximately $62,500-$65,000.
Such compression typically precedes a spike in volatility: the narrower the range becomes, the sharper the eventual breakout is likely to be. The $62,500 buy wall is now the key support level - as long as it holds, the range remains intact; a break below it would open the way toward $62,000 and lower.
What to Watch Next
The immediate focus is on confirming or challenging the disinflationary shift. The July Producer Price Index (PPI) is due on August 13, followed by July retail sales on August 14. The PPI will show whether the producer-price pressures we have been highlighting are feeding through into final prices, while retail sales will indicate whether consumer demand is beginning to weaken alongside the labor market. Both releases will have a direct impact on expectations for the Fed's September meeting.
In crypto, the key indicators remain the behavior of the $62,500 buy wall during pullbacks, the resilience of spot demand against futures selling pressure, open interest dynamics, and, importantly, whether ETF inflows recover or continue to slow.
Analyst Opinion: Dovish Data, but the Market Fears Growth More Than It Cheers Disinflation
Current view: The market remains in a neutral range, but the risk profile has shifted. Previously, the main headwind was a hawkish Fed; now, disinflation and a weakening labor market are likely to bring policy easing back into focus, which is supportive for bitcoin over the medium term. However, price action suggests that, for now, the market is more concerned about economic slowdown than it is encouraged by easing inflation.
Rationale: Bitcoin failed to rally on the softer CPI print and instead corrected, while ETF inflows slowed almost fourfold and futures markets came under short pressure. These are signs of caution. At the same time, the underlying demand structure remains intact: spot buyers continue to buy the dips, while the $62,500-$63,500 zone is densely populated with whale buy orders. In other words, the demand foundation remains solid, but there is not enough fuel for a sustained rally yet.
Confirmation level: A return to sustained ETF inflows and a break and hold above $65,000, which currently marks the upper boundary of the compressed range, would bring a potential upside breakout back into focus - particularly if PPI and retail sales confirm easing inflation without signaling a recession.
Invalidation: A break below the $62,500 buy wall in thin liquidity would open the way toward $62,000 and lower. Downside catalysts could include further deterioration in macroeconomic data that the market interprets as a recessionary signal, renewed ETF outflows, or a hotter-than-expected PPI print that brings producer-price inflation back into focus.
Trading takeaway: In a tightening, low-liquidity market, the priority remains risk management and preparedness for a sharp breakout in either direction. Key levels are the $62,500 buy wall on pullbacks and the $65,000 range boundary on the upside, along with the market's reaction to the PPI and retail sales releases.
Scenarios for the Week Ahead
Neutral scenario. Bitcoin remains within the compressed $62,500-$65,000 range. Spot demand continues to buy the dips, while short positions in futures cap rebounds, and the market awaits the PPI and retail sales data. Thin liquidity increases the amplitude of price moves but does not yet disrupt the overall market structure.
Bullish scenario. PPI and retail sales confirm easing inflation without signs of a recession, the dollar weakens, and ETF inflows resume. Disinflationary optimism outweighs concerns about economic slowdown, allowing bitcoin to break above $65,000 and move toward the upper end of the broader range.
Bearish scenario. Weak economic data are interpreted as a recessionary signal - a “bad news is bad news” environment - or a hotter-than-expected PPI print brings producer-price inflation back into focus. A break below the $62,500 buy wall triggers a move toward $62,000 and lower, amplified by futures selling pressure and thin liquidity.
In Focus: Cooling Consumer Inflation and a Cracking Labor Market Reopen the Easing Debate
Chart: U.S. Consumer Price Index, July release
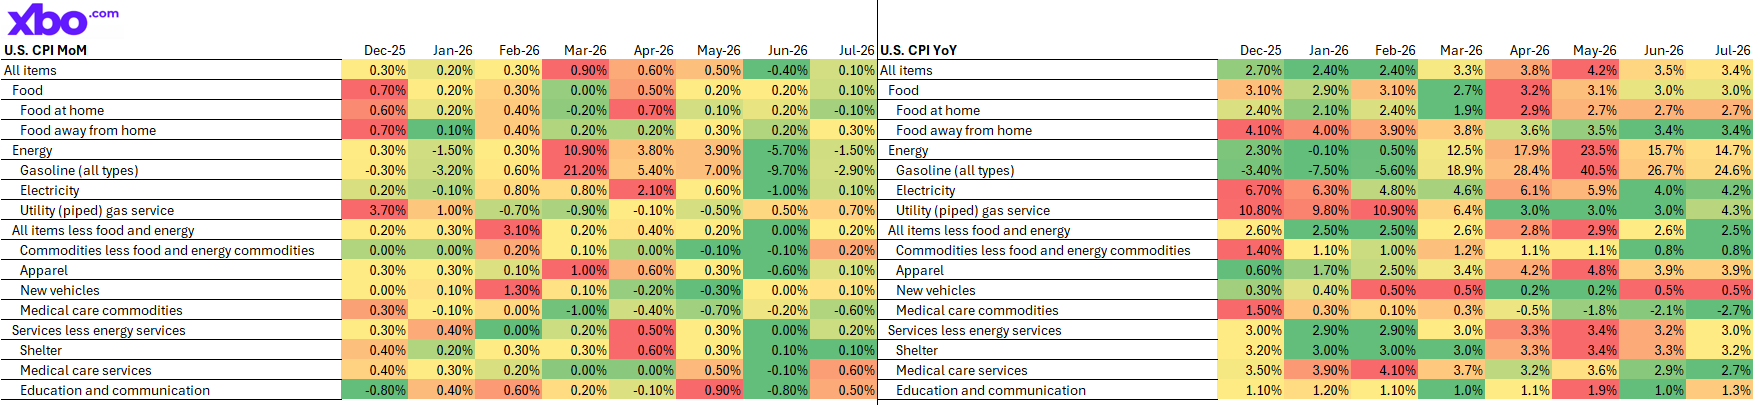
Chart source: U.S. Bureau of Labor Statistics
Asset/market: U.S. CPI by component
Timeframe: Monthly, Yearly
Metric: CPI
Data checked: August 13, 2026, 09:00 UTC
The CPI heatmap shows that consumer inflation has cooled noticeably following the spring surge, when rising oil prices pushed energy costs sharply higher. In March, energy prices increased by 10.9%, while gasoline jumped 21.2% month-over-month. By June, however, headline CPI had fallen to −0.4%, followed by just +0.1% in July. The main drag came from energy: in July, the energy component fell 1.5% and gasoline declined 2.9%, reflecting the correction in oil prices. Core inflation also remained subdued at +0.2% month-over-month, while one of the stickiest components, shelter, slowed to +0.1%.
This is where our July review is worth revisiting. At the time, we warned that the fragile decline in oil prices could reverse and push July inflation higher. That did not materialize on the consumer side - the correction in oil prices prevailed, and monthly CPI came in softer than expected.
The second signal came from the labor market, and it pointed in the same disinflationary direction. Nonfarm payrolls fell by 23,000 in July versus expectations for an increase of 85,000 - a 108,000-job miss. This was no longer just a slowdown in hiring but an outright decline in employment. Other releases confirmed the weakness: ADP private-sector employment increased by only 44,000 versus expectations of 68,000, Private Nonfarm Payrolls rose by 30,000 versus 78,000 expected, and JOLTS job openings declined to 7.36 million from 7.54 million in June. Wage growth also slowed, with average hourly earnings increasing by just 0.1% month-over-month versus expectations of 0.3%. The unemployment rate even fell from 4.2% to 4.1%, but this was largely a function of a shrinking labor force: the Fed had separately highlighted a decline in the labor force participation rate and very weak population growth.
This is where the picture conflicts with the data we discussed previously. In the last review, we noted that while PCE inflation remained relatively subdued, the Q2 GDP deflator jumped to 6.3% - meaning that prices in the broader economy, particularly on the production side, were accelerating even as consumer inflation remained contained. Strong PMI readings and a solid earnings season add to the picture. The result is a mixed macro backdrop: consumer inflation and the labor market are cooling, pushing the Fed toward a more accommodative stance, while producer-price pressures and business activity remain strong. Warsh's comment that AI investment is driving up infrastructure costs fits directly into this production-side inflation story.
The balance of the latest data - softer monthly CPI and a materially weaker labor market - marks the first time in several months that disinflationary signals have emerged alongside clear signs of labor-market deterioration. For crypto, this is a supportive shift over the medium term: expectations of a more accommodative policy and a weaker dollar are favorable for risk assets. But it is not an unconditional green light, precisely because of the macro data discussed earlier. As long as the GDP deflator remains at 6.3% and manufacturing and services activity continues to accelerate, inflation still has a “second front” on the production side that could feed through to consumers with a lag.
This makes the monthly trend the key variable. If consumer prices and wage growth continue to cool in the coming releases, the disinflationary shift will be confirmed and could become a genuine tailwind for bitcoin. If, however, producer-price pressures begin to feed into the consumer basket, the Fed will remain constrained and the current optimism could quickly fade.
Risks for the Week Ahead
- “Bad news is bad news” regime: further deterioration in the labor market could be interpreted as a recessionary signal and weigh on risk assets despite the disinflationary backdrop.
- Producer-price inflation: a hot PPI print on August 13 would confirm that the 6.3% GDP deflator is feeding through into final prices, bringing the prospect of a constrained Fed back into focus.
- Slowing spot ETF inflows: a potential sign of weakening institutional demand.
- Range compression amid thin August liquidity: increasing the risk of a sharp move once the market breaks out of the current corridor.
- A break below the $62,500 whale buy wall: signaling that demand is shifting into defensive mode.
- Futures short pressure: rising open interest alongside increased short positioning against weak spot demand.
- Weak retail sales on August 14: confirming that the cooling labor market is beginning to weigh on consumer demand.
Watchlist for the Week
- July Producer Price Index (PPI): August 13 - is producer-price inflation feeding through into final prices?
- July retail sales: August 14 - is consumer demand weakening alongside the labor market?
- Fed rate expectations: a potential shift toward a September rate cut following weak labor-market data and softer CPI.
- BTC levels: the $62,500 whale buy wall and $62,500-$63,500 demand zone; the $65,000 upper boundary of the current range; and major sell walls at $66,000 and $67,000.
- Spot BTC and ETH ETF flows: a recovery or further slowdown in inflows.
- Open interest and delta: does the “spot buying - futures selling” divergence persist?
Final Takeaway
Bitcoin continues to trade within a tightening range around $63,600, holding its structure but still failing to translate the disinflationary data into upside momentum. The weak labor market and softer July CPI have brought the prospect of Fed easing back into focus, which is supportive for crypto over the medium term through expectations of lower rates and a weaker dollar. However, the market's reaction is telling: bitcoin corrected following the inflation release, ETF inflows slowed nearly 14-fold, and short positions are putting pressure on futures - suggesting that, for now, the market is more concerned about economic slowdown than encouraged by easing inflation.
The underlying demand structure remains intact: investors who prefer to buy the dips continue to absorb pullbacks, while the $62,500-$63,500 zone is densely populated with whale buy orders. The range is tightening from both sides, and the narrower it becomes, the sharper the eventual breakout is likely to be.
The key catalysts this week will be the PPI release on August 13 and retail sales on August 14. They will show whether the disinflationary shift is being confirmed or whether producer-price pressures and weakening demand ultimately dominate. Until then, the priority remains confirmation signals and risk management around the $62,500 and $65,000 levels.
Methodology
This weekly update analyzes crypto market structure, technical indicators, liquidity and market depth, derivatives positioning, options and liquidation data, on-chain activity, and market sentiment alongside asset price performance. It also incorporates relevant macroeconomic, corporate, and regulatory developments. The analysis is based on information available at the time of publication and may change as new market data emerges.
Disclaimer
This report is provided for educational and informational purposes only and should not be considered financial, investment, or trading advice. Cryptocurrency markets are highly volatile, and past performance is not indicative of future results. Always conduct your own research and carefully assess your risk tolerance before making any investment or trading decisions.



.png)