

Weekly Crypto Market Update: Bitcoin Holds Above $77K but a Hawkish Fed and an Iran Shock Cap the Rally - September 3, 2026

Analyst Summary
Over the week, Bitcoin declined by approximately 1.4% but held above $77,500 after reaching a new weekly high of $81,478. ETH lost around 3.7% and is trading near $2,400, while altcoin market capitalization declined by 1.6%. Sentiment, however, remains in greed territory, with the Fear & Greed Index at 72.
The reversal from the highs was driven by two factors. The first was the hawkish speech by Fed Chair Kevin Warsh at Jackson Hole on August 28, after which Bitcoin corrected by approximately 3% in a single day, while the market-implied probability of a September rate hike jumped from 35% to 60% and exceeded 66% by September 1. The second was a new escalation around Iran, which pushed Brent crude up 6% in a single day, drove the yield on 10-year U.S. Treasuries back to 4.8%, and weighed on risk assets and gold.
A positive signal was the resumption of Bitcoin purchases by Strategy: the company bought an additional 4,603 BTC worth $369.7 million for the first time in a while. However, the market structure remains concerning: the rally is being driven by leveraged futures positioning, while spot markets are predominantly selling.
Key Market Snapshot
|
Asset |
7D Change |
Trend |
Analyst Bias |
|---|---|---|---|
|
-1.4% |
Uptrend |
Bullish |
|
|
-3.7% |
Uptrend |
Bullish |
|
|
Altcoins (TOTAL3ES on Tradingview) |
-1.6% |
Uptrend |
Bullish |
Last Week's Watchlist: What Happened?
- BTC levels: the $67,000 breakout we highlighted not only held - Bitcoin pushed through $70,000 and $73,700, reaching $81,478 before pulling back to $77,400. The bullish scenario played out in full.
- Spot vs. futures: spot markets shifted to outright selling near the highs.
- ETF flows: diverged - inflows into Bitcoin funds have been uneven, totaling around $121 million since August 27, while ETH funds have seen steady inflows of $516 million.
- Jackson Hole and the Fed: Warsh took a hawkish stance, triggering the main downside move and a sharp increase in rate-hike expectations.
- Nvidia earnings (August 26): a blowout report on the numbers, but with a muted stock-market reaction.
- Strategy: resumed Bitcoin purchases, buying 4,603 BTC at an average price of $80,318.
What Moved the Market This Week?
The main event was a shift in the Fed's rhetoric. At the Jackson Hole symposium, Kevin Warsh took an unexpectedly hawkish stance, emphasizing that PCE inflation remains at 3.7% year over year and 4.1% over the past six months - well above the target - while financial conditions are difficult to describe as tight, and consumer spending and the labor market remain resilient. Notably, the softer summer inflation data did not convince him: in his view, they do not yet point to a significant change in underlying trends, while the recent rise in commodity prices warrants attention due to inflation risks. This was effectively a direct response to the disinflationary optimism we discussed in August - and the market took notice: the probability of a September rate hike jumped from 35% to above 66%. Warsh also indicated that the Fed should provide less forward guidance to markets and be more cautious about unconventional stimulus measures - an important nuance given the Treasury's launch of its bond buyback program, discussed below.
The second shock came from geopolitics. Attempts to revive an agreement between the U.S. and Iran through Qatari intermediaries failed, Iran officially withdrew from the ceasefire framework, and the Pentagon moved into a phase of “active suppression.” A critical concentration of tankers built up in the Strait of Hormuz awaiting a U.S. escort, and the risk of a complete halt in commercial shipping prompted traders to buy crude for immediate delivery - Brent gained around 6% in a single day. Against this backdrop, Treasury yields returned to 4.8%, while risk assets and gold came under pressure. The combination of a hawkish Fed and a new oil shock was the main driver of Bitcoin's pullback from its highs.
The market also received support from Strategy resuming its purchases - 4,603 BTC worth $369.7 million at an average price of $80,318, meaning the purchase was made close to the weekly highs. This is structurally a positive demand signal, although with the caveat that the purchase was made at elevated levels.
Market Structure: A Leverage-Led Hold While Spot Sells
Chart: BTC Market Data
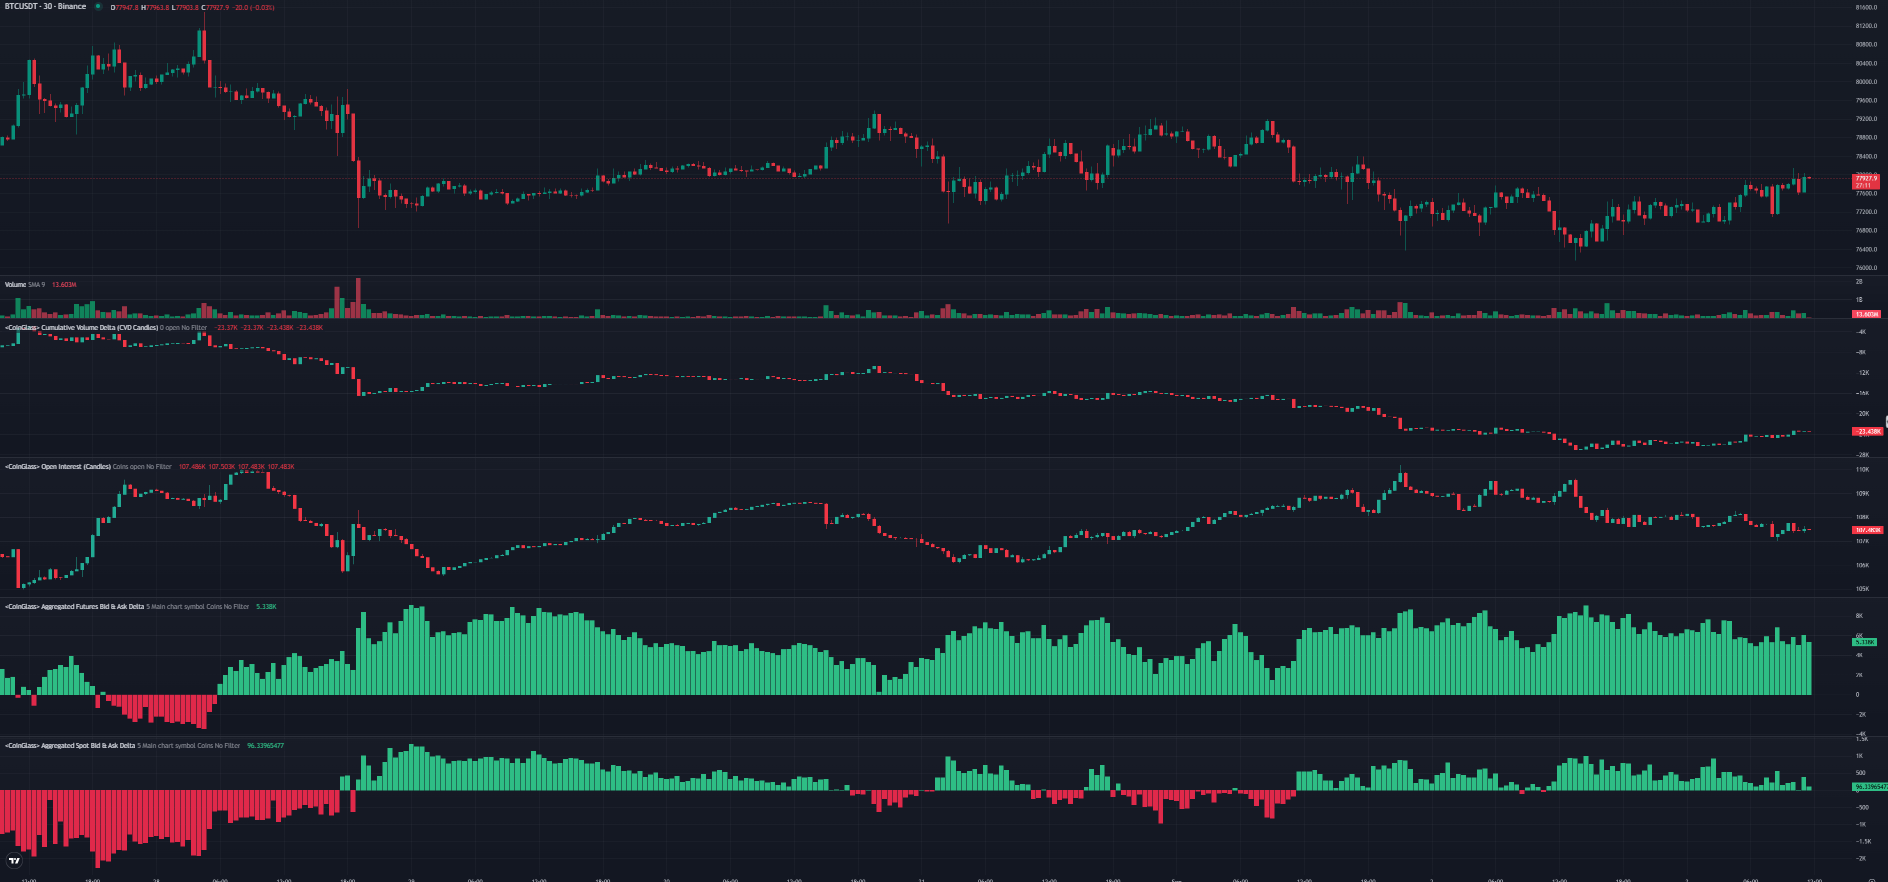
Chart source: CoinGlass
Asset: BTC/USDT
Timeframe: 30 min
Metric: Volume, Cumulative Volume Delta, Open Interest, aggregated futures and spot bid/ask delta
Data checked: September 3, 2026, 09:00 UTC
Under the hood, the picture calls for caution. Futures order delta remains predominantly positive, indicating that leveraged buyers are active, while spot delta is currently predominantly negative: spot participants on centralized crypto exchanges appear more inclined to take profits near the highs. Since August 31, open interest has been rising, while cumulative volume delta has been gradually drifting lower. This combination - rising open interest alongside positive futures delta and negative spot delta - suggests that Bitcoin's ability to hold above $77,000 is being driven primarily by fresh leveraged long positions rather than organic spot demand. This is a classic imbalance: leverage is building in futures while spot markets are selling, leaving the structure vulnerable to a sharp liquidation of longs if the price weakens.
The whale order map confirms the boundaries of the new range. A very dense sell wall sits in the $80,000-$81,000 zone, with more than $20 million in orders concentrated at $81,000 alone, plus a large order at $80,000. This was the wall that rejected the weekly high of $81,478. On the downside, strong support comes from a large cluster of buy orders around $76,000, totaling more than $16 million, with additional support at $75,500-$75,600. The current trading range is therefore roughly $76,000-$81,000, with the immediate battle centered around the current $77,000 level.
The liquidation map brings these signals together into a single risk picture. Given the rising open interest and accumulated futures leverage, the densest cluster of long liquidations is located around $76,000-$77,000, right at the lower boundary of the range. This means that a break below $76,000 could trigger a cascade of long liquidations and accelerate the decline. On the upside, short liquidations are concentrated closer to $80,000, but they are being capped by the same heavy sell wall, limiting the room for an upside squeeze. Overall, the structure is tense in both directions, but the risk is skewed to the downside: heavy long leverage, selling spot markets, and greed at 72 points form a combination that has historically preceded sharp sell-offs.
What to Watch Next
The coming week is extremely busy, and there is more to monitor than just order-book liquidity. The Treasury's bond buyback program launches on September 9, as discussed previously - and this is when it will become clear how the program is being financed and whether it will result in a genuine liquidity inflow into the market or prove to be a neutral maturity twist. Key inflation releases follow: August PPI on September 10 and August CPI on September 11. These figures will show whether the Fed has further grounds to raise rates at its September 15-16 meeting. Given Warsh's hawkish stance and the renewed surge in oil prices, this is currently the key decision point for all risk assets.
In crypto, we will continue to monitor spot behavior relative to futures, the strength of support at $76,000 and the $80,000-$81,000 sell wall, changes in open interest, and ETF flows - particularly whether the divergence between weak inflows into Bitcoin funds and steady inflows into ETH funds persists. Iran and Brent crude will also remain key areas of focus as potential sources of inflationary and risk-off pressure.
Analyst Opinion: A New Higher Range, but a Fragile One
Current view:
Neutral to cautious. Bitcoin has established a new, significantly higher range of $76,000-$81,000, which represents substantial progress from the summer levels. However, the quality of this consolidation remains weak: the move is being supported by leveraged futures positions while spot markets are selling, and the external backdrop has turned negative for risk assets due to the hawkish Fed and the oil shock related to Iran.
Rationale:
In favor of the bulls: the new range, Strategy's resumed purchases, steady inflows into ETH ETFs, and strong whale support around $76,000. Against them: rising open interest alongside negative spot delta and declining CVD, a long-liquidation cluster around $76,000-$77,000, heavy supply at $80,000-$81,000, a probability of a rate hike above 66%, and greed at 72 points near resistance.
Confirmation level:
A return to net spot buying and absorption of the $80,000-$81,000 sell wall alongside sustained ETF inflows would confirm that the range is resolving to the upside. So far, these signals are absent.
Invalidation:
A break below $76,000, given the accumulated leverage, could trigger a cascade of long liquidations and push the price lower toward the next demand zones. Hot August CPI and PPI readings, a hawkish Fed meeting on September 15-16, or further escalation around Iran could accelerate the downside.
Trading takeaway:
Given the leverage imbalance and the busy macro calendar, the priority should be risk management and confirmation signals rather than chasing price. Key levels to watch are $76,000 support on pullbacks and the $80,000-$81,000 sell wall on the upside, along with the market's reaction to the September 9, 10, and 11 events.
Scenarios for the Week Ahead
Neutral Scenario. Bitcoin remains within the $76,000-$81,000 range as the market awaits the Treasury bond buyback program, inflation data, and the Fed meeting. Futures are holding up the price while spot markets are selling sluggishly, and without a strong catalyst, the range is likely to hold.
Downside Scenario. Hot August inflation data or a hawkish Fed meeting reinforce the risk of a rate hike, or Iran continues to push oil prices higher. A break below $76,000 triggers a cascade of liquidations of overcrowded long positions, sending Bitcoin toward lower demand zones.
Upside Scenario. The bond buyback program provides genuine liquidity, inflation comes in softer than expected, and tensions around Iran ease. Spot markets return to buying, Bitcoin absorbs the $80,000-$81,000 sell wall, and attempts to break to new highs.
In Focus: Nvidia's Q2 FY2027 - A Blowout Quarter, a New Margin Problem, and a Direct Answer on AI ROI
Chart: Nvidia Revenue
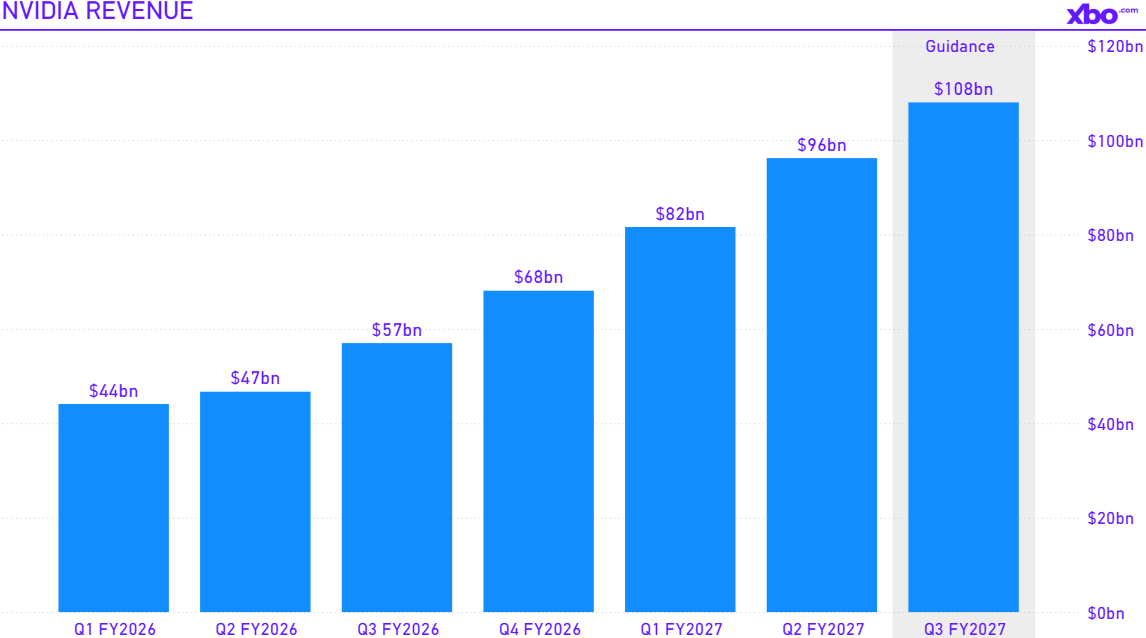
Chart source: Nvidia Investor Relations
Asset/market: Nvidia
Timeframe: Quarterly
Metric: Total Revenue, $
Data checked: September 3, 2026, 09:00 UTC
In the previous issue, we described Nvidia's earnings report as a referendum on the entire AI infrastructure thesis and focused on guidance, margins, China, and signs of uncertainty around the return on AI investment. The report answered all of these questions at once - and the result was far more informative than simply “beating consensus.”
The numbers that improved. Second-quarter revenue came in at $96.2 billion, up 18% quarter over quarter and 106% year over year, beating analyst consensus of approximately $91.8 billion and exceeding management's own guidance by nearly 6%. Non-GAAP EPS came in at $2.22 versus the expected $2.08. The Data Center segment generated $89.0 billion in revenue (+117% YoY), of which hyperscalers accounted for $49 billion, while the ACIE segment - neoclouds, sovereign projects, and enterprise customers - generated $40 billion, up 138% YoY. Gross margin held at 75% for the quarter.
The biggest positive - demand is accelerating even at this scale. For the first time in its history, Nvidia provided a full-year outlook: approximately 70% revenue growth in fiscal 2028, while emphasizing that this forecast is constrained by supply rather than demand. According to management, unconstrained demand is closer to a doubling, or 100% growth. The company backed this up with specific figures: industry cloud backlogs have exceeded $2 trillion; Nvidia estimates that capex by the five largest hyperscalers will reach nearly $800 billion in 2026 and $1.3 trillion in 2027; and AWS is deploying an additional 2 million GPUs. The new Vera Rubin platform has entered production and, according to Nvidia, will represent the fastest product ramp in the company's history, already accounting for around 20% of Data Center revenue in Q3. Jensen Huang summarized the thesis as follows: “AI has reached an inflection point… now compute is revenue, and demand is accelerating.”
A direct answer to the market's biggest concern - ROI. In previous issues, we discussed in detail the gap between AI capex and revenue. On the earnings call, Huang addressed the issue directly: according to him, the return on invested capital for AI data centers is now less than one year - even for facilities costing $50 billion. He also addressed concerns around cheap open-source models: according to Huang, almost all open models run on Nvidia, meaning that the growth of open source does not hurt demand but instead fuels it. If these claims hold, the “AI capex peak” thesis is being pushed further out.
The numbers that deteriorated. The main negative was margins. Due to an extreme increase in memory prices, which exceeded the company's own expectations, Nvidia revised its outlook: gross margin will decline to 74% in Q3, bottom at 71-72% in Q4, and stabilize at 72-73% in fiscal 2028 as price increases take effect. This represents a meaningful compression from 75%, and importantly, the memory shortage is a direct consequence of the same AI boom driving Nvidia's growth.
Balance-sheet signals to watch. Despite record revenue, quarterly operating cash flow fell to $24.1 billion from $50.3 billion in the previous quarter, while free cash flow declined to $21.3 billion. The reason is a sharp increase in working capital: accounts receivable increased, while days sales outstanding rose to 60 days, as the company is providing large, creditworthy customers with payment terms extending several quarters ahead. Inventory rose to $32 billion ahead of the Vera Rubin launch. In addition, historically debt-free Nvidia raised approximately $24.9 billion in debt, while around $7.8 billion of its $59.7 billion in GAAP net income came from the revaluation of stakes in other companies.
Circular financing - now a recognized strategy. Nvidia has invested nearly $50 billion in leading AI labs and directly addressed the criticism: “we know some people will call this circular financing - we see it differently.” To finance construction, the company launched platforms with Apollo, BlackRock, Blackstone, Brookfield, Goldman Sachs, and KKR involving more than $500 billion in third-party capital and introduced a new revenue-sharing model with neoclouds: Nvidia provides a minimum-revenue guarantee for part of the capacity on a take-or-pay basis, against which lenders finance the facility, while Nvidia receives a share of revenue above that threshold - effectively earning twice. The model expands the market and creates recurring revenue, but at the same time means Nvidia is increasingly supporting demand with its own balance sheet: by its own estimate, around one-quarter of next year's business will come from labs that it helps finance. This is the key strategic risk - reflexivity: Nvidia is investing in customers that buy its own chips.
Competition and China. Asked directly about OpenAI and Anthropic developing their own chips - with OpenAI announcing “Jalapeño” and seeking to outperform Blackwell - Huang responded that Nvidia does not sell a standalone chip but a platform for the entire AI lifecycle that operates across any cloud, and he remains confident that the labs will stay customers. Competition from custom ASICs and China's semiconductor industry has not disappeared, but so far it is not reflected in the numbers. China, meanwhile, has effectively been excluded: it accounted for less than 1% of Data Center revenue in Q2, and no revenue from China is included in the outlook.
Market reaction. And here is the paradox: despite these results and the outlook, the stock reacted cautiously and even edged lower - a classic “sell the fact” response. Expectations were so high that even a stellar report failed to generate upside. At the same time, the fundamentals remain exceptionally strong: Nvidia has exceeded its own guidance for thirteen consecutive quarters.
What this means, including for crypto. The key change is that demand has not plateaued but accelerated, and Nvidia provided its first full-year outlook constrained only by supply; the question of ROI also received a direct answer. But the company is paying for this with margin compression caused by the memory shortage and increasing balance-sheet strain - rising debt, receivables, and financing of its own customers. In other words, the story has become stronger on demand but riskier in terms of structure. For the crypto market, the tactical takeaway is that the event risk we identified in advance passed without a shock - there was no repeat of the DeepSeek-style crash, while the AI trade received fundamental confirmation, providing a mild tailwind for risk appetite. However, the stock's muted reaction shows that expectations are extremely high, so this report should not be expected to provide a strong tailwind for risk assets. For holders of tokenized NVDA, the conclusion is the same: the fundamentals are exceptional, but perfection is already priced in, while margins and the scale of balance-sheet commitments are becoming new factors to monitor.
Risks for the Week Ahead
- Hawkish Fed. The market-implied probability of a September rate hike has exceeded 66%, and Warsh's hawkish tone, with a focus on 3.7% PCE inflation, is directly weighing on risk assets.
- Iran and oil. Iran's withdrawal from the ceasefire, the “active suppression” phase, and the deadlock in the Strait of Hormuz are pushing Brent higher (+6% in a single day) and reviving inflation risks.
- Leverage imbalance. Rising open interest alongside selling spot markets creates a risk of a cascade of long liquidations if $76,000 breaks.
- “Hot” August CPI and PPI on September 10-11 could reinforce the rate-hike scenario.
- Treasury buyback mechanism. If the program is financed through Treasury bill issuance, there will be no genuine liquidity inflow - while Warsh has already signaled skepticism toward unconventional stimulus.
- Greed at 71 points near resistance - a contrarian signal that often precedes pullbacks.
Watchlist for the Week
- Treasury bond buyback: launch on September 9 and the financing mechanism (genuine liquidity or a neutral maturity twist).
- Inflation: August PPI - September 10; August CPI - September 11.
- Fed meeting: September 15-16; probability of a rate hike above 66%.
- BTC levels: $76,000 support and the $76,000-$77,000 liquidation cluster; $80,000-$81,000 supply wall.
- Spot vs. futures: a return to net spot buying and changes in open interest.
- ETF flows: the divergence between weak inflows into BTC funds and steady inflows into ETH funds.
- Iran and Brent crude as sources of inflationary and risk-off pressure.
Final Takeaway
Bitcoin held above $77,400, but the week exposed a key vulnerability: after surging to $81,478, the market was reversed by Warsh's hawkish Jackson Hole speech, which pushed the probability of a September rate hike above 66%, and an oil shock driven by escalating tensions around Iran. Structurally, the range is being held by leveraged futures positions while spot markets are selling, and the long-liquidation cluster around $76,000 makes this support level particularly important. There are positive factors - Strategy's resumed purchases and steady inflows into ETH ETFs - but they are outweighed by a busy and potentially hawkish macro calendar. The key catalysts will be the launch of the Treasury bond buyback program on September 9, inflation releases on September 10-11, and the Fed meeting on September 15-16. Until then, the priority is to hold $76,000, monitor spot activity, and manage risk in a highly leveraged market.