


Weekly Crypto Market Update: Bitcoin Holds the $82,500 - $85,000 Range After a $16B Expiry as ETF Demand Absorbs a Bond Market Rout - September 30, 2026
Analyst Summary
Since September 24, Bitcoin has barely moved (-1.3%) and is trading around $83,100. It spent the entire week within a $82,500 - $85,300 range. ETH slipped 0.6% and is trading near $2,700. The market capitalization of altcoins excluding BTC, ETH and stablecoins rose 2.8%. Total crypto market capitalization is holding near $2.94 trillion. The Fear & Greed Index eased to 67, remaining in greed territory.
The key takeaway of the week is that the quarterly options expiry did not trigger a sell-off. This happened against a backdrop that typically weighs on risk assets. Global bond markets went through their sharpest sell-off since the “Liberation Day” turmoil of 2025. The 10-year Treasury yield rose to 5.25%, its highest level since June 2007. Brent crude climbed back above $104 after President Trump rejected Iran’s plan to reopen the Strait of Hormuz. Markets now price in roughly a 72% probability of a Fed rate hike as early as October 28.
ETF demand, however, has not disappeared. Spot Bitcoin ETFs attracted inflows for eight consecutive sessions, totaling about $3.01 billion. The week of September 21-25 brought in $2.39 billion, the strongest result since October 2025. In last week’s review, we identified the key test as whether ETF demand would survive the expiry. It did, although the pace of inflows has slowed noticeably.
Key Market Snapshot
|
Asset |
7D Change |
Trend |
Analyst Bias |
|---|---|---|---|
|
-1.3% |
Consolidation |
Neutral-to-bullish |
|
|
-0.6% |
Consolidation |
Neutral-to-bullish |
|
|
Altcoins (TOTAL3ES on Tradingview) |
+2.8% |
Uptrend |
Bullish |
Last Week’s Watchlist: What Happened?
- Deribit quarterly expiry (September 25): passed without a sell-off. The max-pain level sat near $75,000, almost $10,000 below the price, so there was no pressure pulling price toward it. Instead of expanding, volatility compressed into a narrow range.
- ETF flows after the expiry: remained positive, with $134.5 million on Friday and $31.1 million on Monday. The pace, however, slowed sharply from $999 million on September 21.
- BTC levels: the zone around $85,000 failed to hold and turned into resistance. Price tested bids at $84,000 and $83,000 and twice dipped to around $82,600 - $82,800. The invalidation level held on a closing basis. The $88,000 wall did not come into play.
- Open interest and leverage: OI did not rebuild; instead, it fell from about 106.4K to 93.6K BTC. Deleveraging continued.
- Fed expectations: the risk we flagged materialized. Rate hike expectations shifted from December closer to the October 28 meeting, and according to CME FedWatch, the probability of a hike stood at 72.3% as of September 28.
- DXY, Brent and the 10-year yield: all three worked against the market. Yields hit multi-year highs, the dollar climbed to a nearly two-month high, and Brent moved back above $100.
- Scenario realized: between neutral and downside. The $85,000 zone was lost, but there was no deep pullback to $80,300 - $82,000, and price stabilized.
What Moved the Market This Week?
Bond market rout. Concerns about the Iran war and inflation triggered the sharpest sell-off in US Treasuries and other benchmark government bonds since last year’s “Liberation Day” turmoil. The 10-year yield ended the week around 5.18%, its highest close since July 2007. On Monday it rose above 5.2%, and it is currently holding near 5.24%. The 30-year yield topped 5.5% for the first time since 2004. For crypto, this is a direct headwind: a risk-free yield above 5% raises the opportunity cost of holding assets that pay no coupon.
Oil turns higher again. Last week, falling oil prices were one of the sources of relief. This week, that reversed. President Trump rejected Iran’s seven-day plan to reopen the Strait of Hormuz, and Brent jumped about 4% on Monday to $108.48. Iran passed the plan through Qatari mediators. It envisaged reopening the strait and ending hostilities in exchange for unfreezing Iranian funds, lifting sanctions and ending the naval blockade. The door to negotiations remains open, however: Trump said he expects US negotiators to hold further talks this week.
The Fed: October instead of December. Expensive oil and rising yields have shifted rate expectations. A week ago, markets largely priced the next hike for December. Now CME FedWatch shows a 72.3% probability of a 25 bp hike as early as October 28. Prediction markets Kalshi and Polymarket put the odds at around 69%.
A trade truce with China. The only notable positive was the Trump-Xi summit. The two sides agreed to cut tariffs on “non-sensitive” goods worth about $30 billion from each side, or about $60 billion of bilateral trade in total. The practical results are limited, but the risk of a trade war escalation before year-end has declined.
ETFs: a record week and a fading impulse. The week of September 21-25 brought $2.39 billion into spot Bitcoin ETFs. This surpassed the previous 2026 record of $1.92 billion set in August. Thanks to this week, year-to-date Bitcoin ETF flows turned positive at around $934 million, even though the deficit had reached nearly $6 billion just two months earlier. A week ago, we noted that the funds were still negative for the year. That threshold has now been crossed.
The dynamics within the streak matter as much as its size. Daily inflows declined steadily: $999 million, $715 million, $347 million, $191 million, $134 million and $31 million. Demand persists, but buyers are no longer chasing price.
Demand did not come through ETFs alone. Strategy bought 1,665 BTC for $142.7 million. Ethereum ETFs attracted $689.8 million over the week of September 21-25, reversing the previous week’s outflows. September 2026 became the month in which institutional demand held up prices against a macro backdrop that, in any previous period, would most likely have triggered a sell-off.
Market Structure: Aggressive Sellers vs. Passive Buyers
Chart: BTC Market Data
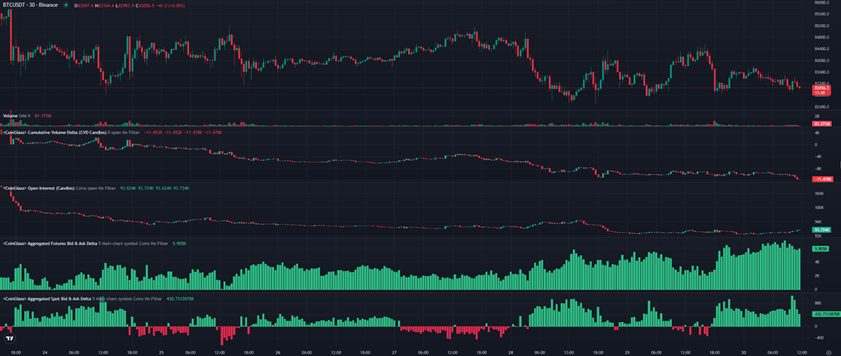
Chart source: CoinGlass
Asset: BTC/USDT
Timeframe: 30 Minutes
Metrics: Price, Volume, Cumulative Volume Delta, Open Interest, Aggregated Bid & Ask Delta (futures and spot), Volume Delta
Data checked: September 30, 2026, 10:00 UTC
Price within the range. From September 24 to September 30, Bitcoin moved just -1.3%. The week began with a sharp breakdown on the evening of September 23: hourly volume delta showed a selling burst of about 1,800 BTC, and price dropped from the $85,000 - $86,000 zone to $84,000. The market then traded within a $82,500 - $85,300 range. Rallies on September 25 and 27 stalled around $85,000 - $85,300. Two dips, to around $82,600 on September 28 and around $82,800 on September 29, were bought. The second low was higher than the first, and price has now returned to around $83,100. Trading volumes are low, which is typical of consolidation.
Futures are selling, and leverage is shrinking. Futures CVD declined steadily throughout the week, from about -5K to -17.9K. This indicates a persistent dominance of aggressive market selling. At the same time, open interest fell from ~106.4K BTC a week earlier to 93.6K, a decline of about 12%. Most of the drop came during the expiry period and the September 28 sell-off. Part of the selling reflects the closing of long positions and hedges rather than the opening of new shorts; otherwise, OI would have risen.
Order books are buying. The aggregated futures bid/ask delta (the balance between limit buy and sell orders in the order books) remained positive throughout the week. Its peaks, up to ~5-6K BTC, came on September 28-29, precisely during the decline. The spot bid/ask delta was also positive most of the time and reached ~800 BTC during the September 28 sell-off. It is currently close to zero.
The picture is clear. Aggressive market selling is meeting dense passive demand in the order books, and price is not falling. This is classic absorption: sellers are spending volume, while buyers place limit orders below the market and absorb the supply.
The key question is which side runs out first. If market selling dries up while bids remain in place, price could move higher with little resistance. If limit buyers step back, the range could break to the downside.
The large-order map: former support has become resistance. The structure of whale orders on centralized exchanges has shifted noticeably lower compared to last week. The demand cluster at $85,000 has now turned into supply.
The effective range is roughly $82,000 - $85,300. The September 28 low (~$82,600) stopped just above the bid cluster at $82,500. About $60 million of supply is stacked above the market up to $85,700. To break out of the range to the upside, buyers need to absorb this block.
What to Watch Next
This week's data cluster will be the main macro test for the consolidation. The calendar includes JOLTS and the Conference Board Consumer Confidence Index; ADP employment, the third estimate of Q2 GDP and the August PCE index; jobless claims and ISM Manufacturing; and the September employment report. Ahead of the releases, consensus expected headline PCE to rise 0.4-0.5% m/m and core PCE 0.3% m/m, while Wells Fargo expected payroll growth to slow to 90,000, with the unemployment rate at 4.1%. Traders may watch not only how the actual figures compare with these expectations, but also how the market digests them in the following sessions, as together they will shape the odds of a Fed hike on October 28.
With the probability of an October hike at around 72%, the asymmetry of the data is clear. A hot PCE print and a strong labor market would effectively lock in a hike on October 28. Softer data could push part of the expectations back to December and ease pressure on yields.
Technically, the key boundaries are $82,000 - $82,500 below and $85,000 - $85,300 above. A breakout from the range will most likely coincide with the release of PCE or the employment report.
Analyst Opinion: A Strong Market Consolidating Against a Weak Macro Backdrop
Current view: Neutral-to-bullish, with a working range of $82,000 - $85,300. Last week’s bullish bias is downgraded to neutral-to-bullish. Price failed to hold the $85,000 zone, and the macro backdrop has deteriorated noticeably. At the same time, structural signs of strength remain intact, so this is a consolidation rather than a reversal.
Rationale: For the bulls: no sell-off after the quarterly expiry, eight consecutive sessions of ETF inflows (~$3.01 billion), year-to-date ETF flows back in positive territory, and reduced leverage. Passive demand in the order books is absorbing market selling, and lows are rising. Against: Treasury yields at their highest since 2007, Brent above $104, and a ~72% probability of an October rate hike. Fading ETF inflows, persistent futures selling (CVD -17.9K), and about $60 million of supply in the $84,400 - $85,700 zone.
Confirmation level: A daily close above $85,300 that absorbs the $85,200 - $85,300 order cluster would bring $87,000 - $88,000 back into focus, where the September 21 and 23 highs are located.
Invalidation: A daily close below $82,000 would open the way to the $80,300 - $81,200 breakout zone, including the $81,159 weekly close. A move below the 50-week moving average near $78,800 would call the entire September breakout into question.
Trading takeaway: The market is in absorption mode, and the direction of the breakout will most likely be determined by macro data. Under these conditions, trading within a narrow range ahead of key releases carries an elevated risk of false breakouts. It is more sensible to wait for the market’s reaction to PCE and the employment report and for confirmation via a close outside $82,000 or $85,300.
Scenarios for the Week Ahead
Neutral scenario. Data comes in close to consensus, and the market continues to consolidate within the $82,000 - $85,300 range. ETF inflows remain small but positive, and open interest stabilizes. This is the most likely outcome ahead of the Fed’s October 28 decision.
Upside scenario. PCE and labor market data come in softer than expected, renewed US-Iran talks push oil lower, and yields retreat from multi-year highs. Market selling in futures dries up, ETF inflows reaccelerate, and Bitcoin closes above $85,300, opening the way to $87,000 - $88,000.
Downside scenario. A hot PCE print and a strong employment report lock in an October rate hike, the 10-year yield continues to rise, and Brent holds above $105. If ETF inflows turn into outflows, limit buyers may step back. A break below $82,000 would open the way to $80,300 - $81,200.
In Focus: Solana - Capital Is Flowing Into the Network and Starting to Work
Chart: Stablecoin Liquidity and Application Fees on Solana
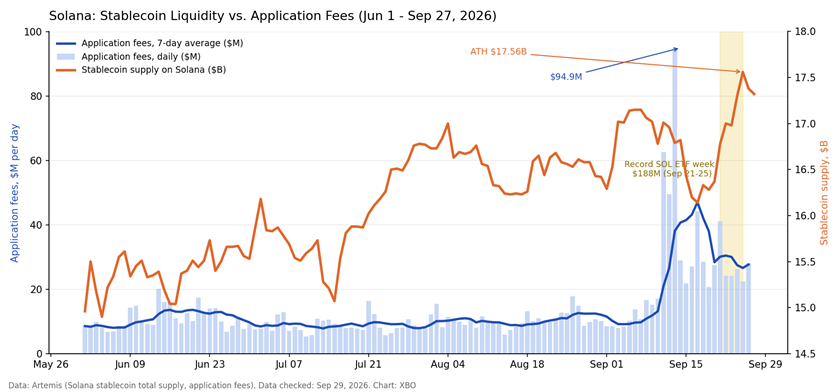
Chart source: Artemis
Asset/market: Solana
Timeframe: Daily
Metrics: Stablecoin Total Supply, Application Fees
Data checked: September 30, 2026, 10:00 UTC
A week ago, we noted that the rotation into altcoins was flowing primarily into fundamentally sound sectors, including smart contract platforms and DEXs. Solana has become the clearest illustration of that thesis.
Last week brought record net inflows of $188.21 million into spot Solana ETFs, with all seven funds finishing the week in positive territory. The Bitwise Solana Staking ETF (BSOL) led with $128.46 million. The streak continued on Monday, with the funds attracting another $12.7 million on September 28. Cumulative net inflows since launch reached $1.618 billion, and net assets stand at $1.925 billion, or 2.76% of SOL’s market capitalization. SOL gained 8.9% over seven days and 17.3% over 30 days, bringing its market capitalization to about $72 billion.
Stablecoin supply on Solana has grown to $17.32 billion, up 21.5% year over year (from $14.25 billion). On September 25, it reached its highest level of the entire period analyzed, at $17.56 billion. The timing also matters: since September 17, when the wave of ETF inflows began, about $1.18 billion in stablecoins has flowed into the network (+7.3% in ten days). Capital is entering both through regulated products and directly on-chain.
The capital is being put to work: application fees have risen 2.5-3.5 times, and this is the key signal of this section:
- In August, Solana applications generated an average of $10.6 million in fees per day.
- From September 12 to 27, the average rose to $35.7 million per day, a 3.4x increase.
- The peak came on September 14, at $94.9 million.
- Over these 16 days, applications collected about 572 million in fees, almost 1.7 times more than in all of August (329 million)
The spike did not prove to be a one-off: after the peak, the 7-day average stabilized around $27.7 million per day, 2.6 times the August level. DeFiLlama data, although based on a different methodology, confirms the direction: on September 12, Solana applications earned $7.935 million in protocol revenue, a 2026 record. That figure exceeded the combined total of four other chains.
Activity is rising, and transactions are getting cheaper.
- Transactions: over the past seven days, the network processed an average of 168 million transactions per day, compared with 75 million a year earlier, or 2.2 times more.
- Users: daily active addresses nearly doubled, from 2.84 million to 5.58 million, and reached 7.96 million on September 22. The active address metric on Solana is sensitive to bot activity, which is why we rely primarily on fees, meaning the money users actually pay.
- Network revenue: averaged $1.24 million per day over the week, compared with $474,000 in June. That is a 2.6x increase and a return almost to the level of a year ago ($1.31 million).
- Cost per transaction: network revenue per transaction fell from about $0.017 to $0.006. The network earns through volume rather than expensive blockspace.
Who captures the value. The key structural shift is the redistribution of value toward applications. A year ago, application fees exceeded the network’s own revenue by 6.8 times; now they exceed it by 34 times. For SOL holders, this is a two-sided signal: the economy around the network is growing much faster than the revenue of the base layer itself and support for the token comes primarily from a reduction in supply. Validators approved SGP-0002, which doubles the pace of inflation reduction from 15% to 30% per year and will cut SOL issuance by about 18.9 million tokens over six years.
In parallel, the network is undergoing a series of technical upgrades. On September 9, Transaction V1 went live with the transaction size limit increased to 4 KB, and on September 18, slot time was reduced to 250 ms.
The weak link: stablecoin velocity. Stablecoin supply has grown 21% over the year, but transfer volume has not. Over the past week, it averaged $16.9 billion per day, compared with $20.3 billion a year earlier. Velocity (transfer volume relative to supply) fell from about 1.3 to 1.0 times per day. In other words, a significant portion of the new stablecoins is sitting in the network rather than circulating. This is not a negative signal, but rather a reserve of liquidity that has yet to be deployed.
To assess how much more capital could still flow into the ecosystem, we compared current metrics with benchmarks. This is an assessment of the capacity of each channel, not an expectation that it will be filled.
- The ETF channel. The record week of $188 million represents about 0.26% of SOL’s market capitalization. The record week for Bitcoin ETFs of 2.39 billion represents about 0.14% of BTC’s market capitalization. Adjusted for asset size, inflow intensity into Solana is roughly 1.8 times higher.
- In terms of penetration, however, Solana still lags significantly: ETFs hold 2.76% of its market capitalization versus ~6.5% for Bitcoin (with Bitcoin ETF net assets of $108.4 billion).
- To reach Bitcoin’s level of penetration at the current price, Solana ETFs would need about $2.7 billion in additional net demand, or roughly 14 weeks at the record pace.
- The potential distribution channel is expanding: Charles Schwab plans to open access to digital assets for more than 39 million active accounts.
- The stablecoin liquidity channel. If stablecoin velocity returns to the level of a year ago (1.3 times per day), daily transfer volume at the current supply would reach about $22.5 billion. That is roughly $5.6 billion more than the current level. This refers to turnover capacity, not to new capital inflows.
- The application economy channel. At the current 7-day pace ($27.7 million per day), the annualized run-rate of application fees is about $10.1 billion, versus about $3.9 billion at the August pace. The gap between these figures shows how sustainable the September activity regime will prove to be.
Solana’s on-chain data shows a rare alignment of three flows. Capital is arriving (stablecoins at a record, record ETF inflows), capital is working (application fees 2.5-3.5 times above August), and part of the liquidity has yet to be deployed due to low velocity. A combined chart of stablecoin supply and application fees is a simple way to track whether this linkage holds. As long as both metrics rise together, the fundamental thesis for Solana remains intact.
Risks for the Week Ahead
- The bond market. A further rise in Treasury yields is the main macro risk. The 10-year yield is already at its highest since 2007, and the 30-year yield is above 5.5%.
- An October rate hike. Hot PCE and labor market data could lock in a hike on October 28.
- Oil and the Strait of Hormuz. A breakdown in US-Iran talks could keep Brent above $105 and intensify inflationary pressure.
- Fading ETF inflows. A shift from inflows to outflows would deprive the market of its main source of support.
- Futures selling. The steady decline in futures CVD shows that sellers are still active. If limit demand steps back, the range could break sharply.
- Sentiment vs. price. The Fear & Greed Index remains in greed territory (67), even though price is flat. This increases the risk of disappointment in the event of a negative macro surprise.
Watchlist for the Week
- BTC levels: support at $82,500 and $82,000, followed by $80,300 - $81,200; resistance at $84,400 - $85,000, $85,200 - $85,300 and $85,700.
- ETF flows: whether the inflow streak continues and whether the slowdown turns into outflows.
- Futures and order books: whether the decline in futures CVD (-17.9K) stops, whether the bid/ask delta stays positive, and whether OI (~93.6K BTC) stabilizes.
- US macro calendar
- The Fed: the probability of a rate hike on October 28 (~72%).
- 10-year Treasury yield, Brent and DXY: as well as the progress of US-Iran talks.
- Altcoin rotation: whether altcoins and ETH continue to outperform BTC.
Final Takeaway
This week was a stress test. The bond market went through its sharpest sell-off since 2025, oil climbed back above $104, and markets began pricing in a Fed rate hike as early as October. Even against this backdrop, Bitcoin ended the week almost unchanged, and the $16 billion quarterly expiry passed without a sell-off. This is a positive structural sign. Aggressive futures selling is being absorbed by limit demand, leverage has declined by ~12%, and ETF inflows have remained positive for eight consecutive sessions, bringing the funds’ year-to-date balance back into positive territory.
However, the inflow impulse is fading, and the $85,000 zone has turned from support into resistance. Bitcoin is consolidating between demand at $82,000 - $82,500 and heavy supply at $84,400 - $85,700, and the direction of the breakout will most likely be determined by PCE and the employment report. A daily close above $85,300 would bring $87,000 - $88,000 back into focus. A close below $82,000 would open the way to the $80,300 - $81,200 breakout zone. Until confirmation, risk management remains the priority.
Methodology
This weekly update analyzes crypto market structure, technical indicators, liquidity and market depth, derivatives positioning, options and liquidation data, on-chain activity, and market sentiment alongside asset price performance. It also incorporates relevant macroeconomic, corporate, and regulatory developments. The analysis is based on information available at the time of publication and may change as new market data emerges.
Disclaimer
This report is provided for educational and informational purposes only and should not be considered financial, investment, or trading advice. Cryptocurrency markets are highly volatile, and past performance is not indicative of future results. Always conduct your own research and carefully assess your risk tolerance before making any investment or trading decisions.