


Weekly Crypto Market Update: Bitcoin Rejected at $85,000 After $1 Billion in ETF Inflows as MSCI Rules Threaten Strategy - October 22, 2026

Analyst Summary
Since October 15, Bitcoin has gained 0.6% to around $82,200. It climbed to nearly $84,900 on October 21, then pulled back on a leverage flush. ETH changed by -0.6% over the week, and the Fear and Greed Index stands at 50.
Spot Bitcoin ETFs have attracted $1.0 billion since October 15, including $526.6 million on October 19, while Ethereum ETFs lost $244.4 million. The week’s main negative: MSCI rules that threaten to exclude Strategy from its indexes.
Key Market Snapshot
|
Asset |
7D Change |
Trend |
Analyst Bias |
|
+0.6% |
Flat |
Neutral |
|
|
-0.6% |
Flat |
Neutral |
|
|
Altcoins (TOTAL3ES on Tradingview) |
-0.9% |
Flat |
Neutral |
Last Week’s Watchlist: What Happened?
- BTC levels: the confirmation level from last week’s review (a daily close above $82,000) was triggered, and price reached the $83,000-$84,400 target zone, briefly exceeding it. The invalidation (a close below $80,000) was not triggered.
- ETF flows: $1.0 billion of inflows.
- Macro: PPI ran very hot; housing starts fell 5.2%; weekly ADP slowed to 18,500.
- Open interest: rose from 92K to 99.5K BTC, then fell to 92.9K.
- Scenario realized: upside, though part of the gains was given back.
What Moved the Market This Week?
Producer inflation accelerated. September PPI rose 1.3% m/m against a 0.6% forecast, lifting the annual rate to 6.3%, the highest since 2022. Retail sales rose 0.8% versus 0.4% expected, while housing starts fell to 1.221 million. Despite hot PPI, October 28 hike odds fell to 14.9%; a December hike remains the base case.
The October 19 inflow: a targeted purchase at support. The entire inflow came from BlackRock’s IBIT (+665.2 million), as Bitcoin traded near the average ETF entry price ($81,500). Such concentration points to a large institutional buyer. Inflows continued in the following days, topping $1 billion since October 15.
MSCI: the main risk of the month. On October 15, MSCI approved rules excluding “non-operating companies” from its global indexes. The final list is due November 11, with exclusions effective after the November 30 close. Strategy, Metaplanet and Yellow Cake are at risk, with ETH treasury firm SharpLink also in question. Polymarket prices Strategy’s exclusion by year-end at 90%.
Strategy has effectively stopped being a major buyer. Last week, it bought only 267 BTC for $22.1 million, while spending $890 million on preferred stock buybacks over five weeks, three times more than on Bitcoin. Since June, its capital framework has allowed BTC sales. An exclusion would trigger index fund selling of MSTR and make raising capital harder, increasing the likelihood of BTC sales for risk management.
If other index providers follow, it would be a major negative for Bitcoin and the market, especially for coins held by treasury companies in such indexes.
Market Structure: The Leveraged Breakout Failed to Hold
Chart: BTC Market Data
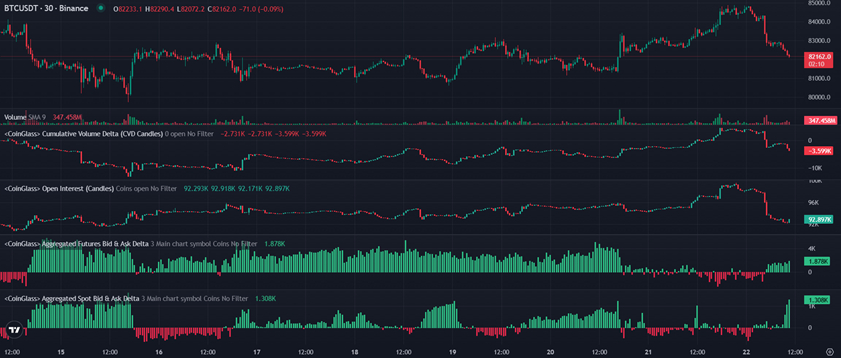
Source: CoinGlass
Asset: BTC/USDT
Timeframe: 30 minutes
Metrics: price, volume, CVD, open interest, bid/ask delta
Data checked: October 22, 2026, 10:00 UTC
On October 21, Bitcoin rose to nearly $84,900 as open interest climbed to 99.5K BTC. At the highs, bid/ask delta turned negative as buyers hit a supply wall near $85,000. On October 22, open interest fell to 92.9K BTC, as 6.6K BTC of mostly long positions were closed, and CVD dropped to -3.6K.
After the flush, spot bid/ask delta rose to +1.3K BTC and futures delta to +1.9K. However, the $47 million cluster at $82,755-$83,043 vanished as price approached: such walls are not guaranteed support.
Whale orders on centralized exchanges show $10.1 million of supply directly above price at $82,211-$82,426 and $12.1 million at $84,500-$84,988. Below, $9.2 million sits at $82,000, $8.9 million at $81,786-$81,987, $3.7 million at $81,500 and $8.3 million at $81,000. In futures and spot, demand within 5% of price still dominates.
The near-term range is $81,500-$82,450 within a broader $81,500-$85,000.
What to Watch Next
Next week’s main event is the October 27-28 Fed meeting. The October 28 decision coincides with Microsoft and Alphabet earnings, followed on October 29 by advance Q3 GDP, September PCE and Amazon’s results.
Analyst Opinion: The Breakout Was Not Confirmed
Current view: Neutral, with a near-term working range of $81,500-$82,450.
Rationale: Bulls have $1.0 billion in ETF inflows, a leverage flush and demand below the market. Bears have the failed breakout near $85,000, Strategy’s exclusion risk and hot PPI.
Confirmation level: A daily close above $85,000, absorbing the $84,988 wall, would open the way to $86,500-$88,000.
Invalidation: A daily close below $81,500, under the average ETF entry price, would open the way to $80,000-$81,000.
Trading takeaway: Holding the $81,500-$82,450 demand zone keeps another attempt higher on the table.
Scenarios for the Week Ahead
Neutral. Consolidation within $81,500-$82,450 ahead of the Fed.
Upside. ETF inflows and strong Big Tech earnings lift price to $84,000-$85,000.
Downside. A hawkish Fed or index news breaks $81,500, testing $80,000.
In Focus: SpaceX and the First Earnings Reports - Strong AI, Energy Pressure
Chart: SpaceX Q3 2026 Results
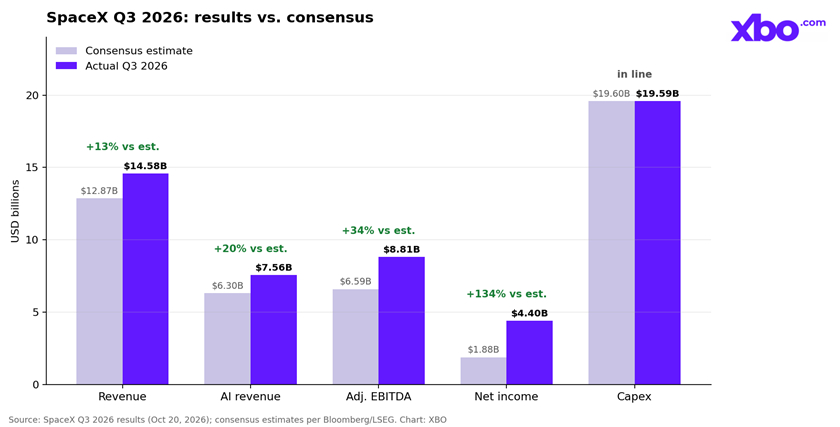
Data source: SpaceX results
Data checked: October 22, 2026, 10:00 UTC
On October 20, SpaceX delivered one of the season’s strongest reports. Revenue grew 161% YoY to $14.58 billion versus $12.87 billion expected. Net income reached $4.4 billion versus $1.88 billion, and adjusted EBITDA $8.81 billion versus $6.59 billion. AI revenue hit $7.56 billion versus $6.3 billion expected and grew more than ninefold, mainly from renting out compute. Capex of $19.59 billion was in line, but Q4 capex is guided at $35-40 billion. The shares gained 9% in premarket trading.
The report shows that compute demand is real and monetized, which matters after the semiconductor sell-off. For Big Tech stocks, it argues for the investment cycle to continue.
On October 21, Meta (EPS of $3.83 against a $3.57 forecast) and Tesla (adjusted EPS of $0.48 against $0.44, with a gross margin of 19.6%) also beat expectations. Tesla left its BTC untouched in Q3.
Consumer-facing companies differ. Netflix beat on earnings but lowered its revenue and advertising guidance, and its shares fell.
For the Fed, this is a two-speed economy: AI investment and demand are strong, energy costs are passing through to prices, and housing is weakening. A strong AI cycle supports risk appetite but, with hot inflation, keeps the Fed hawkish.
Risks for the Week Ahead
- Strategy: BTC sales for risk management.
- Inflation: hot PPI raises October CPI risk.
- The Fed: a hawkish signal on October 28.
- Earnings: disappointment in Big Tech earnings on October 28-29.
Watchlist for the Week
- BTC levels: support at $82,000, $81,500 and $81,000; resistance at $82,450, $83,000-$83,400 and $84,500-$85,000.
- ETF flows: whether inflows continue.
- Open interest: whether leverage rebuilds from 92.9K BTC.
- The Fed: the October 28 decision and shifting December hike expectations.
- October 29: Q3 GDP and September PCE.
- Earnings: Microsoft and Alphabet (October 28), Amazon (October 29).
- MSCI: the risk of shifting expectations for the final list.
Final Takeaway
Bitcoin played out the confirmation scenario, but the leveraged breakout above $84,400 failed, returning the price to $82,200 on October 22. ETF inflows exceeded $1 billion, and buyers are once again placing orders below the market. The main risk is MSCI’s decision on Strategy. A close above $85,000 would target $86,500-$88,000; a close below $81,500, $80,000.
Methodology
This weekly update analyzes crypto market structure, technical indicators, liquidity and market depth, derivatives positioning, options and liquidation data, on-chain activity, and market sentiment alongside asset price performance. It also incorporates relevant macroeconomic, corporate, and regulatory developments. The analysis is based on information available at the time of publication and may change as new market data emerges.
Disclaimer
This report is provided for educational and informational purposes only and should not be considered financial, investment, or trading advice. Cryptocurrency markets are highly volatile, and past performance is not indicative of future results. Always conduct your own research and carefully assess your risk tolerance before making any investment or trading decisions.