


Weekly Crypto Market Update: Bitcoin Returns to $83,000 After Hawkish Fed Minutes and ETF Outflows as the ETH Staking Exit Queue Hits a 2026 High - October 8, 2026

Analyst Summary
Since October 1, Bitcoin has slipped about 0.6% and is trading around $83,100. Over the week, it approached local highs in the $86,700-$87,250 area three times and was rejected each time, and on October 8 it dipped intraday to around $82,150. ETH lost 4.1% over the same period, falling to around $2,574. The market capitalization of altcoins excluding BTC, ETH and stablecoins declined by 2.9%. The Fear & Greed Index dropped to 60.
The week began with macro relief. Core PCE inflation for August came in at 3.0% against a 3.3% forecast, while the economy added just 29,000 jobs versus expectations of 90,000. The probability of an October Fed rate hike fell from 71% to 22% within a week, lifting Bitcoin above $87,000. However, the $87,000-$88,000 supply zone was held. Overnight on October 7, the market went through a long liquidation: Bitcoin fell from $85,341 to $83,577 in 20 minutes, and $412.6 million in positions were liquidated within an hour, more than 97% of them longs.
The second half of the week was shaped by hawkish minutes from the Fed’s September meeting and a reversal in flows. On October 7, spot Bitcoin ETFs lost about $487 million, the largest daily outflow in weeks. As a result, their balance since the start of October turned negative at -$165.6 million. Ethereum ETFs have lost about $506.2 million since October 1. Pressure on ETH was compounded by the largest staking exit queue of the year, formed almost entirely by the precautionary exit of MetaMask Staking validators following the September 30 incident.
Key Market Snapshot
|
Asset |
7D Change |
Trend |
Analyst Bias |
|---|---|---|---|
|
-0.6% |
Downtrend |
Neutral |
|
|
-4.1% |
Downtrend |
Neutral |
|
|
Altcoins (TOTAL3ES on Tradingview) |
-2.9% |
Downtrend |
Neutral |
Last Week’s Watchlist: What Happened?
- PCE and the labor market: both releases came in softer than expected. Core PCE printed at 3.0% versus 3.3%. Payrolls rose by 29,000 versus 90,000 expected, August was revised down from 162,000 to 133,000, and unemployment rose to 4.2%.
- The Fed: the probability of a rate hike on October 28 fell from 71% to 22%. The minutes of the September meeting, however, confirmed that most participants expect another hike before year-end.
- BTC levels: the confirmation level from last week’s review (a daily close above $85,300) was triggered, and price reached the $87,000-$88,000 target zone, peaking at around $87,250 on October 2. The $88,000 wall was not broken. By the end of the week, the market moved back down: on October 8, price tested the $82,000-$82,500 support intraday (low of $82,150), and it held. Last week’s invalidation level (a daily close below $82,000) was not triggered.
- ETF flows: the streak of Bitcoin ETF inflows was interrupted by an $89.8 million outflow on October 5, resumed with a $118.9 million inflow on October 6, and then gave way to an outflow of about $487 million on October 7. Ethereum ETFs recorded outflows for seven consecutive sessions.
- Leverage: instead of further deleveraging, open interest rose again, from about 93K to 100K BTC at the October 2 peak. It now stands at around 96K.
- DXY, Brent and the 10-year yield: yields eased after the employment report, but the dollar continued to strengthen (DXY around 102.3), and Brent is holding near $104.
- Scenario realized: in the first half of the week, the upside scenario played out: soft data and a break above $85,300. In the second half, the market failed to hold above $87,000 and returned to the lower boundary of last week’s range.
What Moved the Market This Week?
Inflation below forecast, but with caveats. Core PCE inflation for August came in at 3.0% against a 3.3% forecast. Almost the entire surprise came from a change in the methodology for pricing investment advice, legal services and software, with revisions going back to January 2021. July core inflation was revised from 3.3% to 3.0%, and headline inflation from 3.7% to 3.4%. Core inflation for Q1 was lowered from 4.4% to 3.9%, while Q2 GDP growth was raised from 1.5% to 2.2%.
The revision is annual and scheduled, but all three methodological changes moved inflation only lower. At the same time, headline inflation accelerated by 0.3% m/m in August due to fuel prices.
The labor market pointed the same way. The economy added just 29,000 jobs against a forecast of 90,000, August data was revised from 162,000 to 133,000, and unemployment rose to 4.2%. After the September rate hike, weak data is being read as good news: futures pricing for an October hike fell from 71% to 22% within a week. Goldman Sachs Asset Management believes the door to an October hike is effectively closed, while one hike in December remains its base case. It was on this data that Bitcoin climbed above $87,000.
The Fed minutes brought back a hawkish backdrop. The minutes of the September meeting, released on October 7, turned out noticeably more hawkish than the market had expected after the weak employment data. All 19 participants supported the September rate hike, and most believe another hike will likely be needed before the end of 2026. Several Fed officials believe that even after the September move, policy is not yet restrictive enough to contain the economy and inflation. Inflation risks remain tilted to the upside, and some participants noted that they have intensified further in recent months. Many supported the hike partly as a precautionary measure to prevent high inflation from becoming entrenched amid strong demand and new price shocks.
One point deserves particular attention: the Fed discussed the need to prepare tools in advance in case of stress in the Treasury market.
The Fed staff outlook for economic growth and the labor market improved compared with July, and risks to employment are seen as broadly balanced. Despite the rise in long-term yields, many participants consider financial conditions supportive of growth. For the market, this means that a pause in October does not amount to a policy reversal: a December hike remains the base case.
Oil and the dollar are capping optimism. Brent is holding near $104 and remains within the $98-$108 range it has traded in since mid-September. President Trump said the US will “very soon” begin refilling the Strategic Petroleum Reserve, and do so “for free,” without providing details. Experts, however, point out that refilling the reserve will be a complex and far from free process that could take years. Meanwhile, the Department of Energy continues to release oil from the reserve: an exchange of up to 40 million more barrels has been announced, with deliveries in November-December.
What matters for the market is that the promise to refill the reserve implies additional future demand for oil, which means pressure on energy inflation is not going away. The dollar index rose from 101 to 102.3 over the week, despite the reduced odds of an October hike. The October 7 sell-off coincided with rising oil prices, yields and the dollar.
Seasonality favors the bulls. October has historically been one of Bitcoin’s strongest months. According to CoinGlass, since 2013, BTC has closed October in the red only three times (in 2014, 2018 and 2025), with an average monthly gain of around 20%. Lookonchain analysts note that historically, the most powerful BTC rallies have started in October. Seasonality is not a trading signal, but it explains why the market is willing to buy dips early in the month.
ETFs: a reversal in flows. Until October 6, Bitcoin ETFs held up better than the market: despite an $89.8 million outflow on October 5, the monthly balance remained positive at around $321.5 million. On October 7, the funds lost about $487 million, the largest daily outflow in weeks, and the balance since the start of October turned negative at -$165.6 million. Net assets of Bitcoin ETFs declined to about $107.4 billion. Ethereum ETFs have recorded outflows in every session since September 29, and since October 1, their outflows have totaled about $506.2 million, including $160.8 million on October 7.
Market Structure: Sellers Are Pressing, Limit Buyers Are Defending $82,000
Chart: BTC Market Data
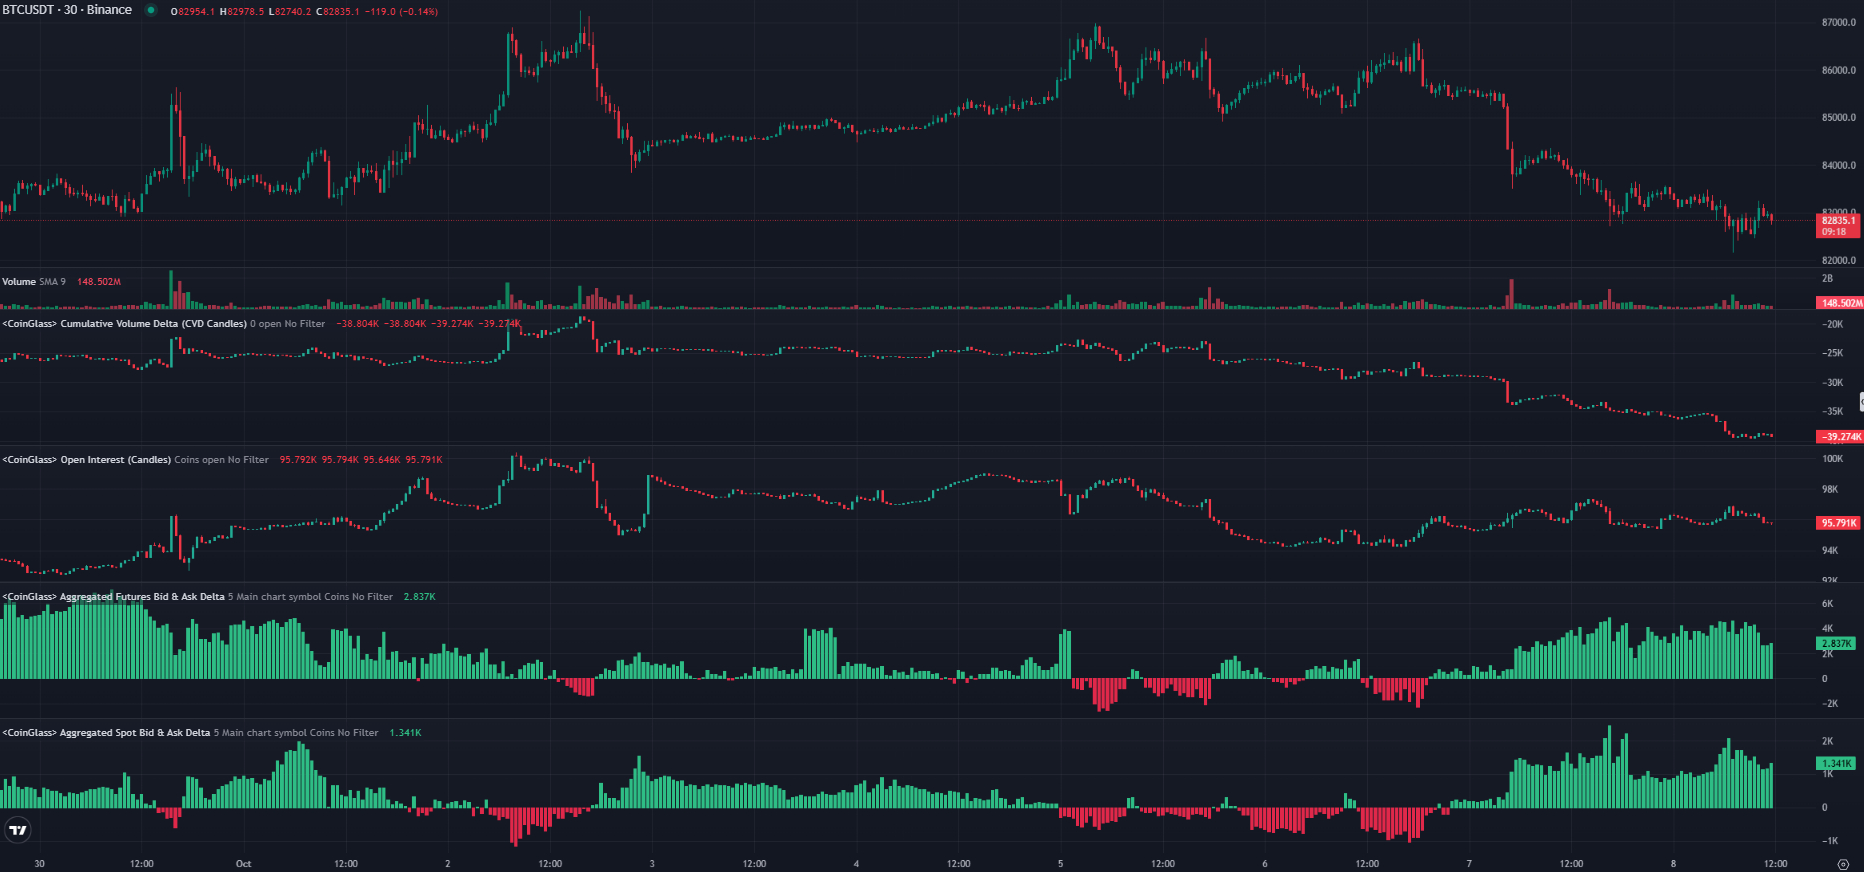
Chart source: CoinGlass
Asset: BTC/USDT
Timeframe: 30 Minutes
Metrics: Price, Volume, Cumulative Volume Delta, Open Interest, Aggregated Bid & Ask Delta (futures and spot)
Data checked: October 8, 2026, 09:00 UTC
In last week’s review, we described the market as being in absorption mode and asked which side would run out first. At the start of this week, it was the market sellers who ran out first. Soft PCE data triggered the first buying impulse (volume delta of +1.5K BTC), and the employment report pushed the price to $87,250 on October 2. However, the nature of this rally was different from September’s.
A leverage-driven rally, not a spot-driven one. Open interest rose from about 93K BTC on September 30 to 100K at the October 2 peak. In September, price was driven by spot demand as leverage declined; this time, the rally was financed by new long positions. Already on October 2, after the high, the market printed the largest selling burst of the week (delta of -1.65K BTC), and OI fell to 95.5K.
Three lower highs. After the first rejection, the market made two more attempts to return to the highs: to $86,900 on October 5 and to $86,700 on October 6. Each attempt stalled below the previous one. The order books show why: during both tests, the aggregated bid/ask delta in both futures and spot turned negative, meaning limit sell orders dominated at the highs. Buyers reached the supply zone but could not absorb it.
A leverage flush followed by a slow grind lower. On October 7, Bitcoin fell from $85,341 to $83,790, touching a low of $83,577. $412.62 million in positions were liquidated within an hour, more than 97% of them longs. Analysts at Zeus Research attribute the decline primarily to profit-taking and forced liquidations, as rising open interest and funding rates had left the market vulnerable to deleveraging. The rebound after the flush stalled at $84,300-$84,400. From there, amid the Fed minutes and ETF outflows, price drifted steadily lower and dipped intraday to $82,150 on October 8. Volumes are noticeably lower than at the start of the month: the selling is orderly rather than panicked, but persistent.
Shorts are building, limit buyers are not leaving. CVD has declined from about +2K to -11.2K since the start of October, and the decline continued after the flush. Open interest, meanwhile, is not shrinking and is holding around 96K BTC. Falling prices combined with declining CVD and stable OI means that new shorts are replacing the liquidated longs: as we anticipated after the flush, some traders are opening short positions into rebounds.
The opposite side is active too. Since the morning of October 7, the aggregated bid/ask delta has held at +3-4.6K BTC in futures and +1-2.2K in spot. This is the most sustained dominance of buy orders on the chart all week. The market has returned to the absorption regime we described in late September, but with one important difference. Back then, limit buyers held their level. Now they are moving their orders lower: the $11.7 million cluster at $83,000 that we highlighted after the flush has been either filled or pulled, and price has moved below it.
This combination carries risk in both directions. If sellers keep pressing and limit orders step back, the range will break to the downside. If the pressure runs out, the shorts accumulated at the lower boundary of the range could fuel a sharp rebound.
The large-order map. The structure of whale orders on centralized exchanges has shifted lower along with price. Directly above the market, at $83,200-$83,420, there is a cluster of sell orders worth about $13.7 million, including a fresh $5.9 million order at $83,420. Higher up, supply is sparse, with a few million dollars each at $84,500, $85,000, $86,000 and $86,500, up to the dense $87,000-$87,500 zone, where about $19.5 million is stacked.
Below, demand is laid out like a ladder. About $11.7 million is spread across $82,800-$83,000, about $9 million sits at $82,450-$82,566, and another $10.6 million at $82,000. Further down are about $9 million at $81,500-$81,888 and the largest demand wall on the map, about $14.9 million at $81,000. This zone coincides with the $81,300 level, which analysts identify as the average entry price of Bitcoin ETF investors and the starting point of the September breakout.
The near-term working range has narrowed to $82,000-$84,400. To return to the upper part of the broader $82,000-$87,250 range, buyers first need to absorb the $83,200-$83,420 cluster and reclaim $84,400, where the post-flush rebound stalled.
What to Watch Next
The next two weeks will shift the focus from the labor market to inflation. The key release is September CPI on October 14. The Fed’s Beige Book is published on the same day.
On October 15, September retail sales and PPI are released. The Philadelphia Fed (37.8) and NY Empire State (7.6) indices are also published that day, along with jobless claims.
After PCE came in below forecast mainly because of a methodology change, and the Fed minutes emphasized upside inflation risks, CPI will test whether inflation is genuinely slowing. A hot CPI print amid expensive gasoline could revive expectations of a hike on October 28, while a soft one could lock in a pause until December. Technically, the key boundaries are $82,000 below and $84,400 above.
Analyst Opinion: From Confirmation to a Test of the Lower Boundary
Current view: Neutral, with a near-term working range of $82,000-$84,400 within the broader $82,000-$87,250 range. The bias is downgraded from neutral-to-bullish. The market failed three times to break $87,000 and returned to the lower boundary of the range. The Fed minutes brought back a hawkish backdrop, and Bitcoin ETFs turned to outflows. At the same time, the $82,000 support held, and the order books show sustained limit demand, so it is too early to speak of a downside reversal.
Rationale: On the bullish side are soft PCE and labor data, a low probability of an October rate hike, and a sustained dominance of buy orders in both futures and spot order books. A ladder of demand is stacked below the market down to $81,000, and shorts accumulated near the lower boundary could fuel a rebound. October seasonality has historically been favorable.
Against: three lower highs, a $487 million outflow from Bitcoin ETFs on October 7, a continued decline in futures CVD alongside stable OI, and a supply cluster directly above price. The macro backdrop is not on the buyers’ side either: the Fed minutes pointed to another hike before year-end, the dollar is strengthening, and Brent is holding near $104.
Confirmation level: A daily close above $84,400 that absorbs the $83,200-$83,420 cluster would bring $85,000-$86,500 back into focus. Full bullish confirmation still requires a close above $87,300.
Invalidation: A daily close below $82,000 would open the way to $81,000-$81,300, where the largest demand wall and the average entry price of ETF investors sit. Below that lies the lower boundary of the September breakout zone near $80,300. A move below the 50-week moving average near $78,800 would call the entire September breakout into question.
Trading takeaway: The market has returned to the lower boundary of the range with both sellers and limit buyers active. Under these conditions, the outcome will be decided by which side steps back first. Ahead of the October 14 CPI release, it is more sensible to watch the reaction at $82,000 and $84,400 and the behavior of open interest. Rising OI on a breakdown would intensify the pressure, while a sharp drop in OI during a rebound would signal short covering.
Scenarios for the Week Ahead
Neutral scenario. Bitcoin consolidates within the $82,000-$84,400 range ahead of the CPI release. ETF outflows slow, open interest remains stable, and limit demand continues to absorb selling.
Upside scenario. CPI expectations remain moderate, and selling pressure runs out. Accumulated shorts start to close, Bitcoin absorbs the $83,200-$83,420 cluster and closes above $84,400, opening the way to $85,000-$86,500. A return of ETF inflows would set the stage for another attempt at $87,000.
Downside scenario. Fed comments or expectations of a hot CPI print increase bets on a hike, the dollar continues to strengthen, and Brent moves above $108. Bitcoin ETF outflows continue, and limit buyers step back. A close below $82,000 would open the way to $81,000-$81,300, and then to $80,300.
In Focus: Ethereum - Operational Stress or Capital Flight?
Chart: Ethereum Validator Entry and Exit Queues
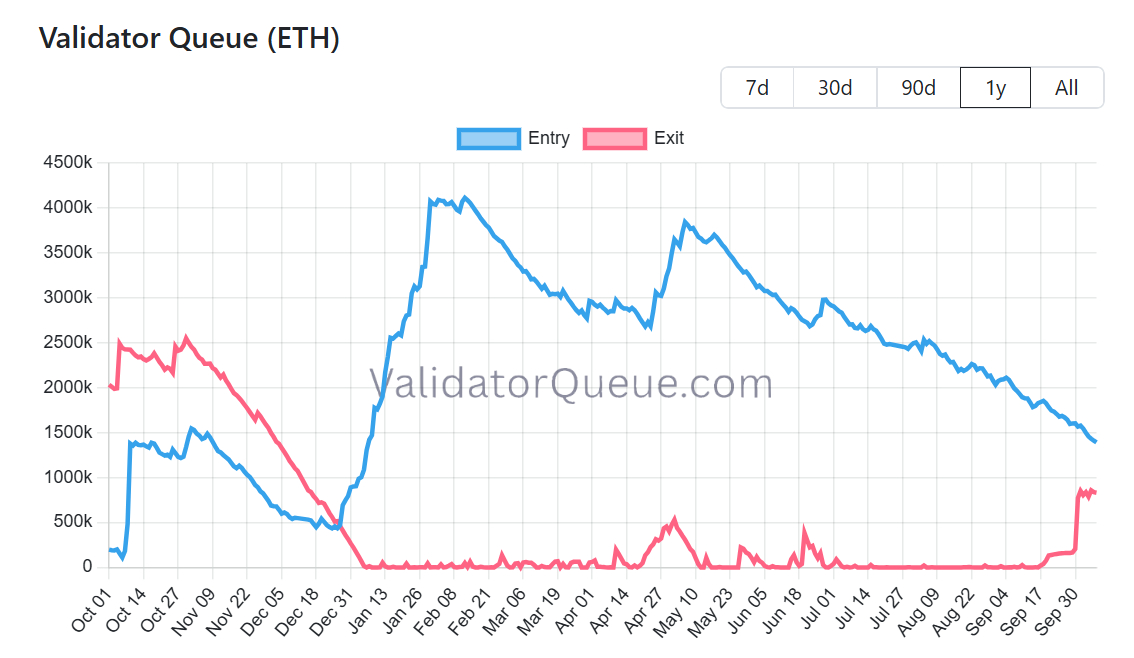
Chart source: ValidatorQueue.com
Asset/market: Ethereum (staking)
Timeframe: Daily
Metrics: Entry Queue, Exit Queue (ETH)
Data checked: October 8, 2026, 09:00 UTC
This week, Ethereum looked noticeably weaker than Bitcoin. From September 30 to October 6, ETH traded in a $2,650-$2,780 range and approached the $2,775-$2,800 resistance twice, on October 2 and October 5, but failed to hold above it. Overnight on October 7, ETH became the epicenter of liquidations, falling from about $2,688 to $2,591. ETH liquidations over 24 hours totaled $176.3 million, compared with $145 million for Bitcoin. The largest single liquidation was a $26.64 million ETH-USDC position on Binance, and Lookonchain flagged a trader who lost a 3,728 ETH long worth $9.85 million in three minutes. The pressure continued after the flush: ETH broke through the $2,550-$2,600 support intraday, dropping to $2,537, and is currently trading around $2,574. Since October 1, it has lost 4.1%.
Why money is leaving the ETFs. Since October 1, Ethereum ETFs have lost about $506.2 million. This is a sharp reversal from the week of September 21-25, when the funds attracted $689.8 million. Outflows have occurred in every session since September 29: $201.9 million on October 6 and another $160.8 million on October 7.
Analysts point to several reasons. The first wave of outflows came at quarter-end and is attributed to portfolio rebalancing. Then a rotation became visible: on October 1, Bitcoin ETFs attracted $103 million while Ethereum funds lost $55 million. This pointed to investors leaving Ethereum specifically rather than the crypto market as a whole, although by October 7, outflows had spread to Bitcoin funds as well. Derivatives added to the pressure: taker volume turned deeply negative, and the estimated leverage ratio for ETH fell to a seven-month low. Derivatives traders are selling more aggressively while still maintaining significant exposure.
Another factor we have been highlighting since September also matters. The current ETH staking yield is about 2.59% per year, roughly half of the Treasury yield above 5%. For institutional investors, this noticeably reduces Ethereum’s relative appeal as a yield-bearing asset. The hawkish Fed minutes only reinforce this gap.
The exit queue in numbers. The staking exit queue rose from 166,000 ETH on September 29 to a peak of about 851,000 ETH on October 2. Today it holds 832,000 ETH, or about $2.1 billion. That is roughly 1.9% of the 43.7 million ETH staked and the highest level of 2026: the previous peak, in May, was around 476,000 ETH. The estimated exit wait time is about 14.5 days. The entry queue, meanwhile, stands at 1.39 million ETH with a wait of 24 days, compared with 2 million ETH and 35 days in early September.
The main cause is a single operator. On September 30, MetaMask reported a security incident affecting part of its infrastructure. As a precaution, its staking unit, MetaMask Staking (formerly Consensys Staking), began exiting the validators it operates within the Lido protocol. According to estimates by researcher Kaden and analyses by Bitquery, this involves about 17,000 validators and 523,000-565,000 ETH. MetaMask has not officially confirmed these figures.
The amount stolen was negligible: about 0.36 ETH in rewards from 18 blocks. According to MetaMask, there are no signs that wallets or customer funds were affected. Lido expected the last affected validators to exit by October 7. ETH will return to the protocol gradually, and the full cycle of exit, withdrawal and re-entry could take up to 45 days because of the long entry queue.
Operational stress, not a mass capital withdrawal. Most of the queue represents a temporary rotation away from a single operator. These coins are likely to return to staking rather than go straight to exchanges. This is precisely why the protocol limits the exit rate: it prevents abrupt shifts in the validator set and security parameters. Price held up in the meantime: from September 30 to October 5, ETH traded in roughly a $2,650-$2,740 range. The pressure is spread over two weeks plus a separate withdrawal stage, which is why the spot market has barely reacted.
What the entry queue is telling us. The second metric on the chart is just as important. The entry queue (1.39 million ETH) still exceeds the exit queue by about 1.7 times, meaning net demand for staking remains positive. However, it has been declining steadily, from peaks of about 4.1 million ETH in February and 3.8 million in May to the current 1.39 million. This signal is slower but more telling: new capital inflows into staking are cooling, which is consistent with ETF outflows and the low staking yield relative to Treasuries.
Ethereum’s weakness this week reflects two different stories. The record exit queue is operational noise tied to a single operator and capped by the protocol. We expected it to start shrinking after October 7, but so far it is holding at around 832,000 ETH. The real risk lies in flows: ETF outflows, rotation into Bitcoin, aggressive selling in derivatives and cooling demand for new staking.
The key signals in the coming weeks will be a shrinking exit queue and a growing entry queue. It is also important that there is no spike in ETH inflows to exchanges; only then can we speak of coins returning to staking. A halt in Ethereum ETF outflows would remove the main source of pressure. Technically, ETH is trading near its weekly lows: the nearest support is $2,530-$2,550, and resistance is at $2,650-$2,685, the former lower boundary of the range. Above that lies the $2,775-$2,800 zone.
Risks for the Week Ahead
- Inflation. A hot CPI print on October 14 amid expensive gasoline could revive expectations of a rate hike on October 28.
- A hawkish Fed. The minutes of the September meeting pointed to another hike before year-end and upside inflation risks. Any Fed speeches in the same vein could add pressure on the market.
- The dollar and oil. DXY around 102.3 and Brent near $104 remain the main macro headwinds. The promise to refill the Strategic Petroleum Reserve supports oil demand.
- ETF flows. The $487 million outflow from Bitcoin ETFs on October 7 and seven consecutive sessions of Ethereum ETF outflows are weakening the market’s main source of support.
- Leverage. Growing short positions with stable open interest increase the risk of sharp moves in either direction: a liquidation cascade on a breakdown or a short squeeze on a rebound.
- Technical risk. Three lower highs near $87,000 and a return to the lower boundary of the range point to weakening buyers.
Watchlist for the Week
- BTC levels: support at $82,800-$83,000, $82,450-$82,566 and $82,000, followed by $81,000-$81,300; resistance at $83,200-$83,420, $84,400, $85,000 and $87,000-$87,500.
- Open interest and funding: whether shorts continue to build with stable OI (96K BTC).
- ETF flows: whether outflows from Bitcoin and Ethereum ETFs stop after October 7.
- Inflation, October 14: September CPI and the Fed’s Beige Book.
- Macro releases, October 15: September retail sales; PPI; the Philadelphia Fed (37.8) and jobless claims.
- DXY, Brent and the 10-year Treasury yield.
- Ethereum: the staking exit queue (832,000 ETH), the entry queue (1.39 million ETH), and levels at $2,530-$2,550, $2,650-$2,685 and $2,775-$2,800.
Final Takeaway
The week played out in two stages. First, the upside scenario unfolded by the book: PCE inflation and the labor market came in softer than expected, the probability of an October rate hike fell to 22%, and Bitcoin closed above $85,300 and reached $87,000. But the $87,000-$88,000 supply zone held for the third time. The leverage-driven rally ended with $412 million of longs liquidated within an hour. Then the hawkish Fed minutes and a $487 million outflow from Bitcoin ETFs pushed price back to the lower boundary of the range.
At the same time, the $82,000 support held, and buyers continue to place limit orders: the bid/ask delta in the order books remains consistently positive while sellers press with market orders.
Ethereum looks weaker than the market. The record staking exit queue is operational stress from a single operator, capped by the protocol. ETF outflows, the low staking yield relative to Treasuries and cooling demand for new staking deserve closer attention.
Bitcoin is trading in an $82,000-$84,400 range within the broader $82,000-$87,250 range. A daily close above $84,400 would bring $85,000-$86,500 back into focus, while a close below $82,000 would open the way to $81,000-$81,300. The key catalyst will be the October 14 CPI release, and until confirmation, risk management remains the priority.
Methodology
This weekly update analyzes crypto market structure, technical indicators, liquidity and market depth, derivatives positioning, options and liquidation data, on-chain activity, and market sentiment alongside asset price performance. It also incorporates relevant macroeconomic, corporate, and regulatory developments. The analysis is based on information available at the time of publication and may change as new market data emerges.
Disclaimer
This report is provided for educational and informational purposes only and should not be considered financial, investment, or trading advice. Cryptocurrency markets are highly volatile, and past performance is not indicative of future results. Always conduct your own research and carefully assess your risk tolerance before making any investment or trading decisions.