

Candlestick Charts Explained: How to Read Candles and Spot Patterns
If you've ever looked at a coin's price on our platform, you might have seen candlestick charts: the red and green candles that fill the screen. To a casual eye they may mean nothing more than green for "up" and red for "down."
But each candle holds four separate pieces of information, and once you can read them, a crypto candlestick chart reveals far more than the basic direction.
What is a candlestick chart and what it shows
A candlestick chart is made up of individual green and red "candles." Together they map out how an asset’s price has moved. If you've come across OHLC charts before, candlestick charts show the same four data points but in a more visual format.
Each candle covers a set period of time (a minute, an hour, a day, depending on the timeframe you choose). In that period, it records four prices:
- Open: the price when the period began
- High: the highest price reached
- Low: the lowest price reached
- Close: the price when the period ended
On XBO.com, these four values sit at the top of every chart, marked O, H, L and C.
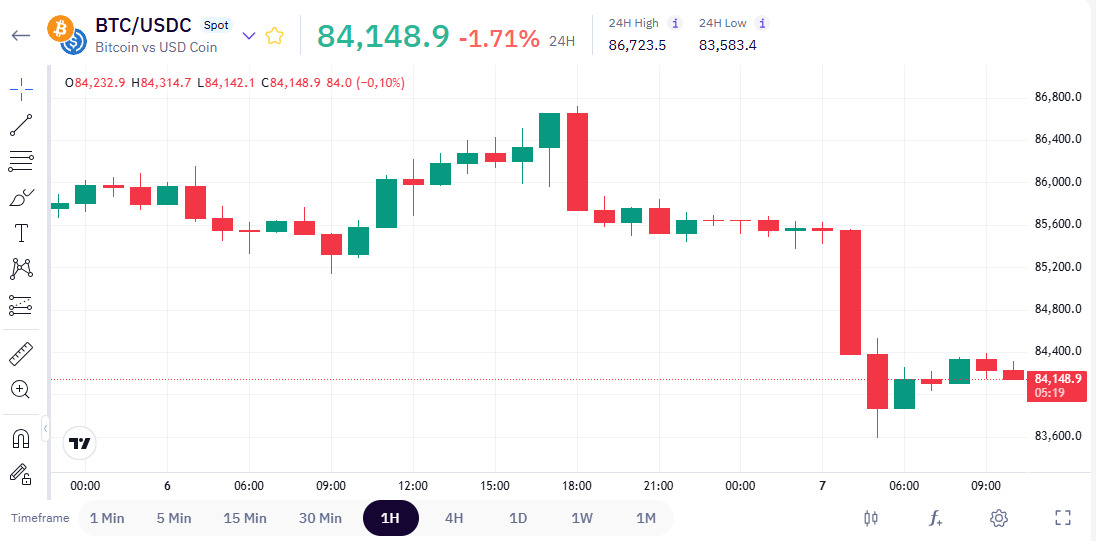
Each candle shows these prices visually:
- The body is the distance between the open and the close.
- The wicks (the thin lines above and below) reach up to the high and down to the low.
- The color tells you the direction: green means the price closed higher than it opened, red means it closed lower.
What one candle tells you about price movements
Once you can read the shape, a single candle shows you how buyers and sellers pushed the price during that period.
- A long body means one side was firmly in control, buyers pushing the price well up, or sellers pushing it well down.
- A small body is a sign of hesitation, meaning that neither side got far.
- Long candlestick wicks mean the price reached a level, above or below, but couldn't hold it and pulled back before the close. The level was tested and rejected.
Common candlestick patterns
Some candle shapes appear often enough that traders have given them names. Here are three of the most common.
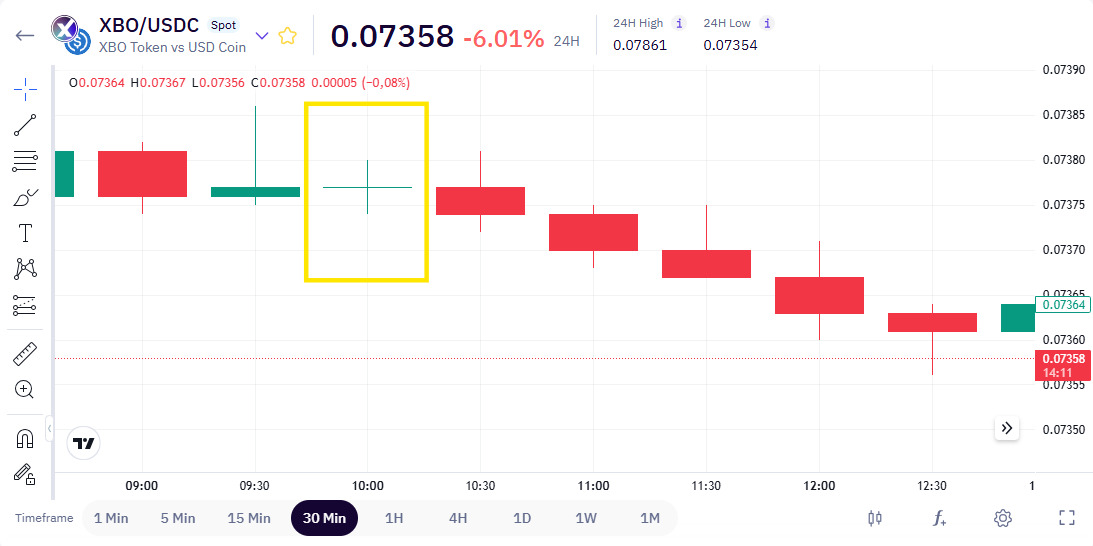
1) Doji candle. A candle with almost no body, where the open and close are nearly the same. It points to indecision, with neither buyers nor sellers taking control.
2) Hammer candle. A candle with a small body and a long lower wick. It shows the price fell sharply during the period, then recovered much of the ground by the close.
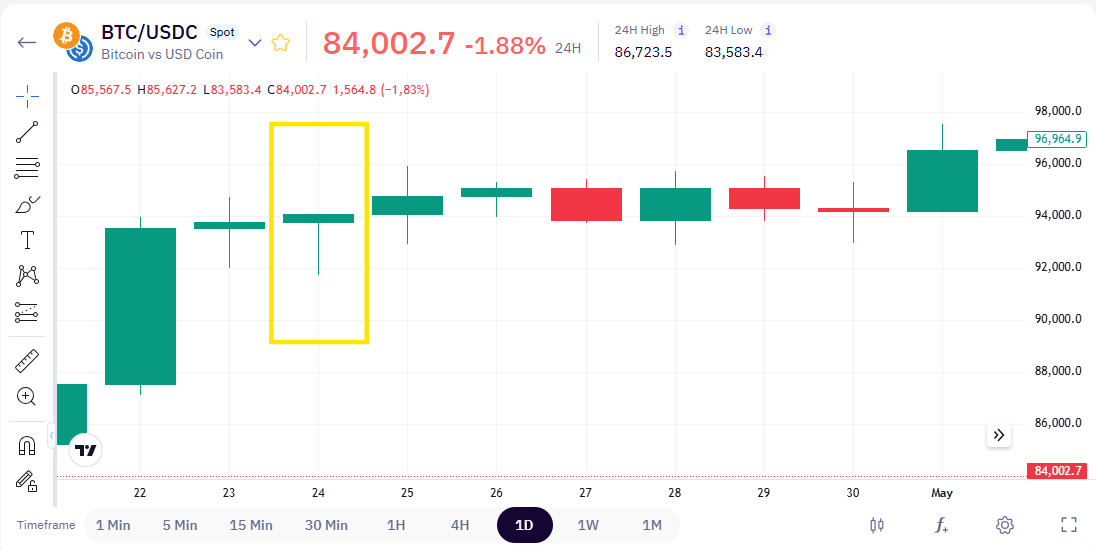
3) Engulfing candle. A candle whose body covers the previous one, in the opposite color. Traders watch it as a sign that momentum may be shifting from one side to the other.
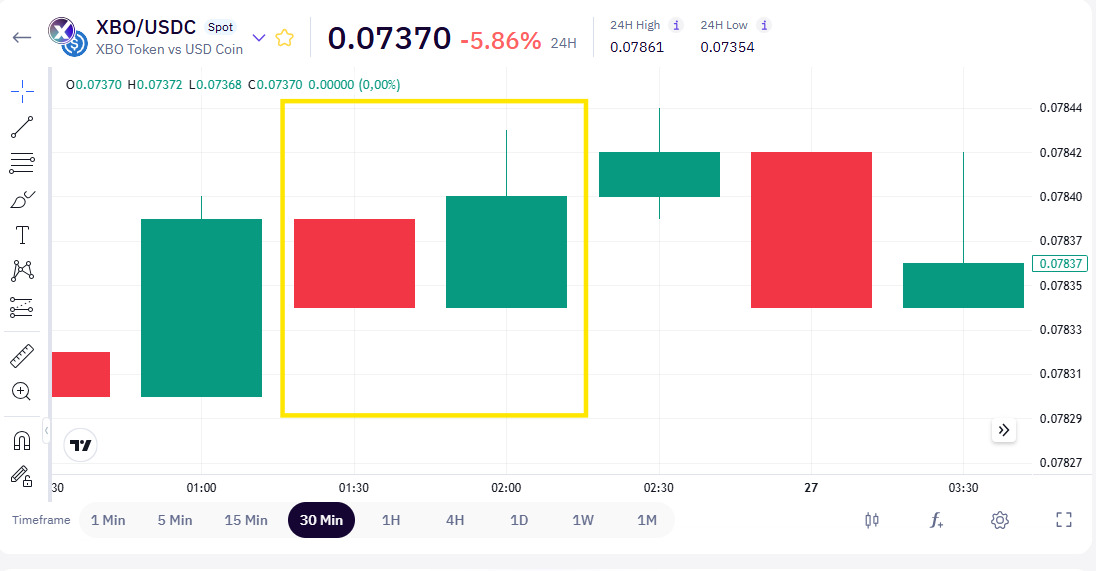
Importantly, these candlestick crypto chart patterns don't predict anything. They show a situation that has already formed on the chart, which traders then interpret in their own way. They're one input among many, never a guarantee of what comes next.
Try it on a real chart
Reading about candles is a great first step into crypto technical analysis, but the best way to learn is to look at real examples. Open any trading pair on XBO.com, set the chart type to candles from the controls below it, and try to read what the market has been doing.
Disclaimer: Our content does not constitute financial advice. It is only intended for informational and educational purposes.