

Q3 2026: A Rally Without Fuel
How Bitcoin Gained 42.6% While the Fed Was Tightening
Key Takeaways
- Bitcoin gained 42.6% in its first positive quarter in a year. The move occurred in the absence of three conditions normally considered necessary for a rally: the Fed was raising rates, stablecoin inflows were flat, and the market structure bill had been defeated in the Senate.
- The rally was funded by exhausted supply, not new demand. Bitcoin held on exchanges fell to 2.684 million BTC, the lowest level in the entire observed period. At the same time, four sources of selling dried up: short-term holders capitulated in July, miners switched to AI contracts, Strategy returned to buying, and whales continued accumulating.
- Stablecoins stopped shrinking but did not grow. The net change for the quarter was +$0.8 billion against a $477 billion increase in Bitcoin’s market capitalization (a ratio of roughly 70 to 1), meaning new dollars were not driving the move.
- The expanded Treasury buyback moved markets through narrative rather than liquidity. The August 19 announcement lifted Bitcoin by more than 7% and wiped out $1.36 billion in short positions, but long-end yields rose 40 bp over the life of the program and banking system reserves contracted.
- The quarter consisted of two distinct markets. Before August 19, only Bitcoin was rising, with four of the seven tracked sectors in the red. After that date, all seven sectors outperformed BTC, and the deeper a sector had fallen, the sharper its subsequent rebound was. That pattern reflects rotation and leverage, not new capital entering the market.
- The regulatory landscape determined the winners. After the CLARITY Act failed, the SEC and CFTC took over the agenda. Real-world asset tokenization closed the quarter at +119.8% with a maximum drawdown of just 1.9%, which made it the only sector that led in both halves of the quarter.
- The September rally was bought on credit. Open interest rose by $10.5 billion while spot delta was falling, then collapsed by $9.2 billion. The perpetuals sector, the most leverage-sensitive of all, ended up as the quarter’s worst performer.
1. Introduction
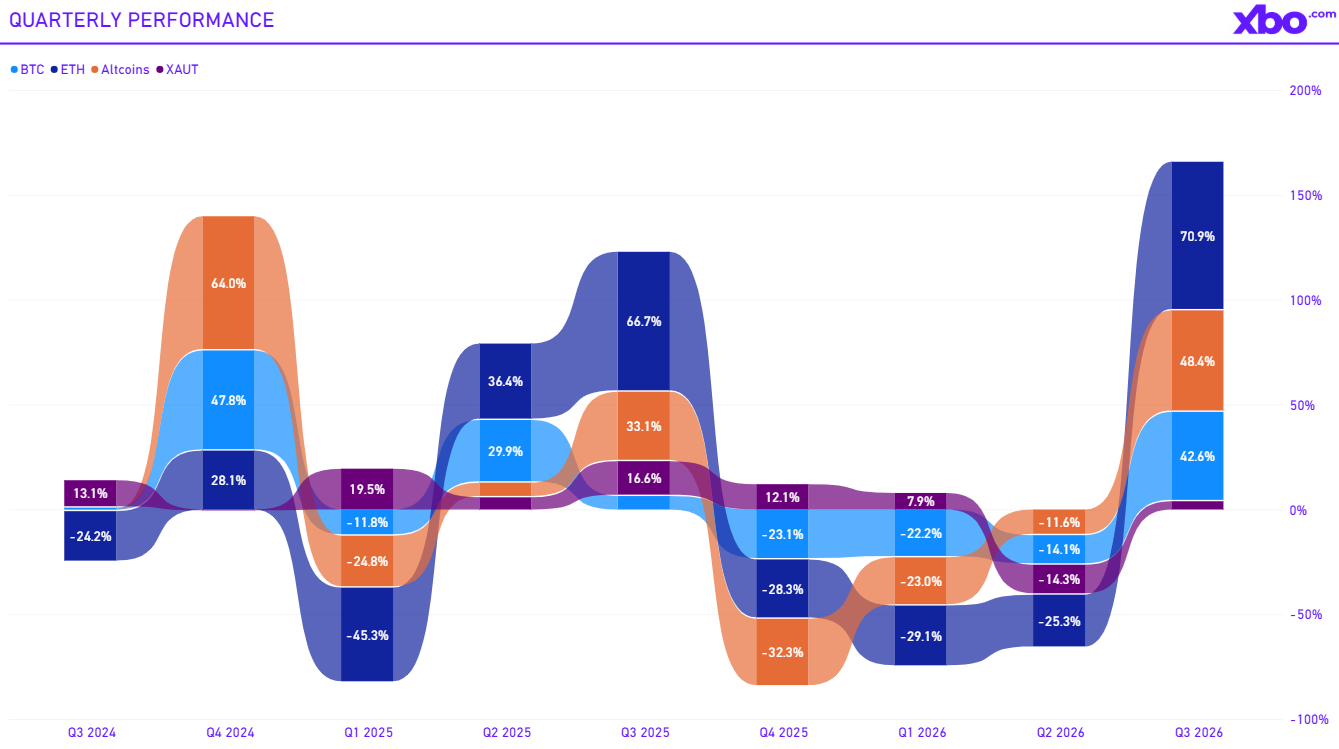
The third quarter of 2026 broke a run of three consecutive losing quarters. Bitcoin added 42.6%, Ethereum 70.9%, and the altcoin basket 48.4%.
Source: XBO
The context makes these numbers more striking. Over the previous three quarters the market lost ground consistently: Bitcoin posted quarterly declines of 23.1%, 22.2%, and 14.1%, while Ethereum declined 28.3%, 29.2%, and 25.3%. The only asset generating positive returns over that period was gold, which gained 12.1% and 7.9% in Q4 2025 and Q1 2026 respectively. In Q3 2026 the dynamics reversed: gold added only 3.9%, while the crypto market delivered a result an order of magnitude higher. Meanwhile, altcoins outperformed Bitcoin for the first time in five quarters, returning 48.4% against Bitcoin’s 42.6%.
External conditions did not improve but rather deteriorated. The Fed raised rates for the first time since 2023 and lifted its projected path into 2027. Oil nearly doubled. The ten-year Treasury yield added 78 basis points and closed the quarter at its highest point of the year. The main crypto market regulation bill failed in the Senate. Stablecoin supply, the principal gauge of risk-ready liquidity, stayed flat.
This report is built around that contradiction: why crypto rose despite all of it. We work through every possible explanation for the rally (macroeconomic, fiscal, and liquidity-driven) and show that none was likely the cause. What remains is a supply-side mechanism that explains Bitcoin’s behavior but does not scale to the rest of the market. We then examine how capital was distributed between sectors in the absence of new inflows, and what criteria drove that allocation.
2. Monetary Conditions: The Price of Money Went Up
The second quarter ended with a conditional forecast: the market had fallen because of the price of money rather than its quantity, and a durable reversal required two things: a Fed that stopped tightening and renewed growth in stablecoin issuance. The third quarter delivered neither. The Fed raised rates for the first time since 2023, and by the end of September the market was pricing a second hike as more likely than not.
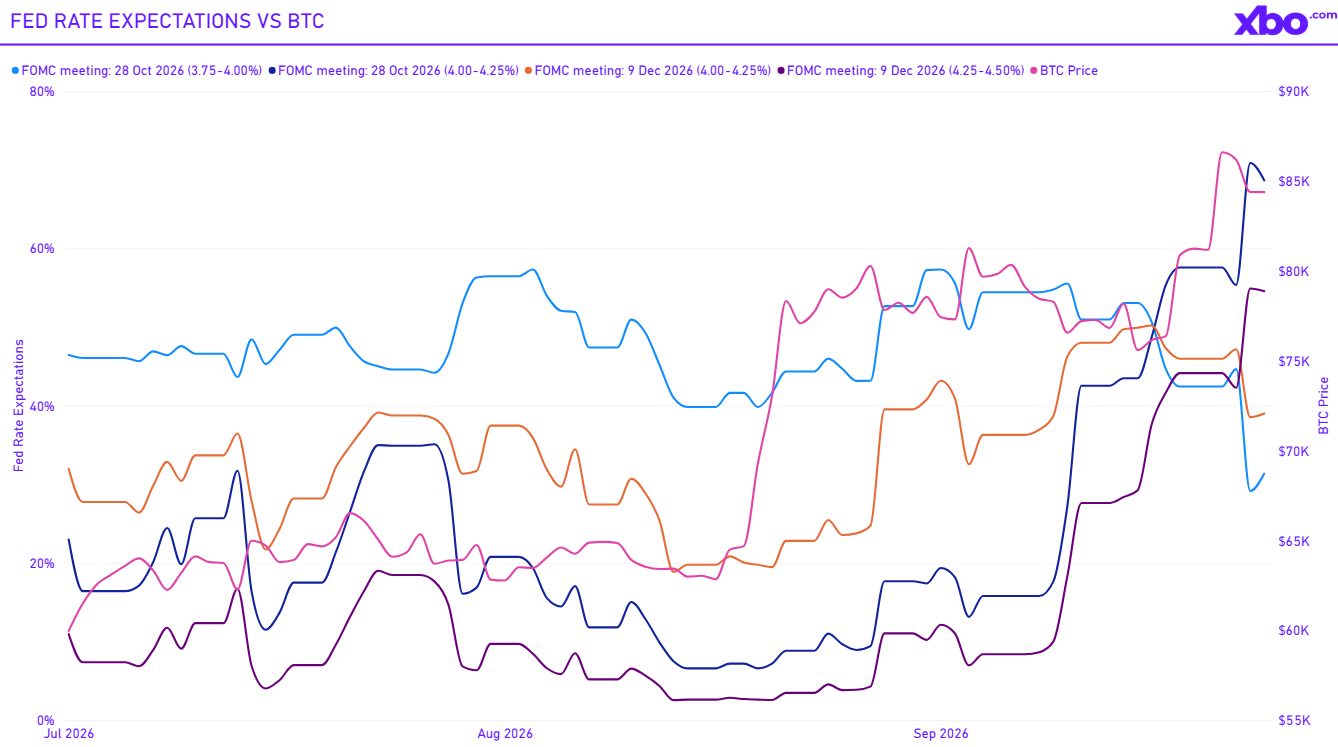
The quarter moved through three distinct regimes, seen most clearly when rate expectations and Bitcoin are placed on the same axis.
Source: CME FedWatch Tool, FRED
July: the market expected a pause and heard the opposite. On July 29 the FOMC held the range at 3.50–3.75%, but the vote was 9–3, with all three dissents calling for a hike in an unusually hawkish split. Kevin Warsh abandoned forward guidance as a tool and said plainly that if inflation stayed at its current level, hikes would return to the agenda. The advance estimate of second-quarter GDP released the following day confirmed the stagflationary picture: 1.5% annualised growth with a 6.3% deflator.
August: a disinflationary window that closed. July payrolls came in at -23K against expectations of roughly +85K, and July CPI added just 0.1% month-on-month. Expectations of further tightening collapsed. By August 19 the market put the probability of a 4.00–4.25% range at the October meeting at just 6.6%, and two hikes by December at 2.6%. Those were the lows of the quarter. On the same day, Bitcoin rose more than 7% on news that the Treasury was expanding its long-end buybacks. It was the only moment in the quarter when easing expectations and a crypto rally coincided.
September: the repricing completes. Warsh’s Jackson Hole address on August 28 dismissed the summer data as noise rather than a change of trend, and the repricing was immediate and one-directional. August payrolls came in at +162K, August CPI was hot, and the September 16 decision delivered a 25 bp hike to 3.75–4.00%, unanimous at 12–0. The probability of an October hike moved to 68.6%, and of two further hikes by December to 54.6%. The dot plot followed: the median path for both end-2026 and end-2027 was lifted to 4.1% from 3.8% and 3.6% respectively, with 16 of 18 participants expecting at least one more increase.
Consumer and Producer Inflation
The Fed’s decision looks inconsistent with the headline data only until the price measures are separated by where they are generated.
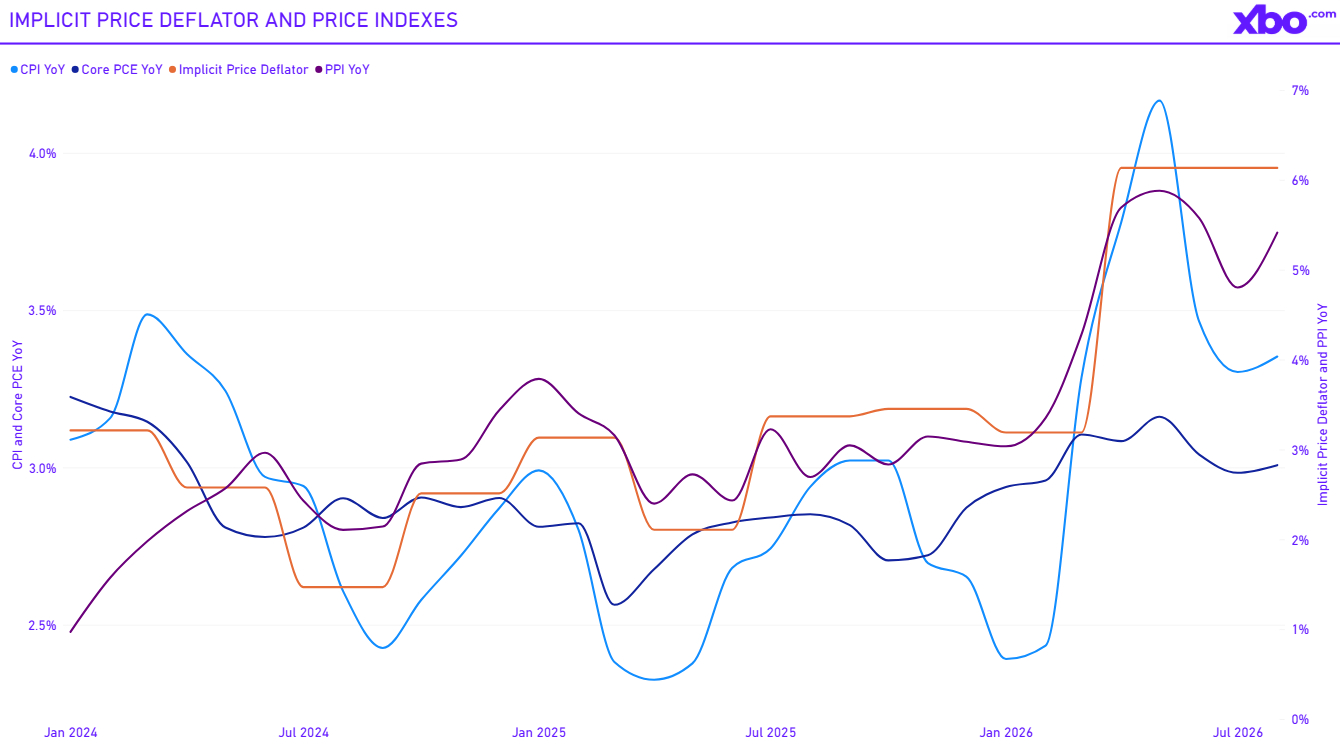
Consumer inflation genuinely cooled. CPI fell from a May peak of 4.17% year-on-year to 3.30% in July and 3.35% in August, with core PCE holding near 3.0%. The producer side, however, did not follow: PPI stayed above 5% year-on-year throughout the quarter, and the GDP deflator ran at 6.1% annualized. That represents a gap of roughly three percentage points between what households pay and what the economy charges to produce. A significant part of the relief on the consumer side was energy-driven, and therefore borrowed rather than earned.
One revision, published on the final day of the quarter, sharpens the picture considerably. The BEA’s third estimate revised second-quarter real GDP upward to 2.2% annualized, from the advance figure of 1.5%. The first quarter was also revised upward, to 2.5%. Real final sales to private domestic purchasers grew 4.6%, and the deflator was trimmed from 6.4% to 6.1%. The stagflationary framing on which market pricing rested all quarter proved largely wrong. The economy was in fact overheating, driven by a surge in AI-related capital expenditure, rather than exhibiting the weakness the advance data suggested. Even so, the gap between a 6.1% deflator and 2.2% real growth remains the widest in eight quarters.
This changes how the Fed’s actions should be read. Judged against the data in its final form, the September hike was not aggressive but rather overdue.
Oil, the Long End, and a Broken Hedge
Source: FRED
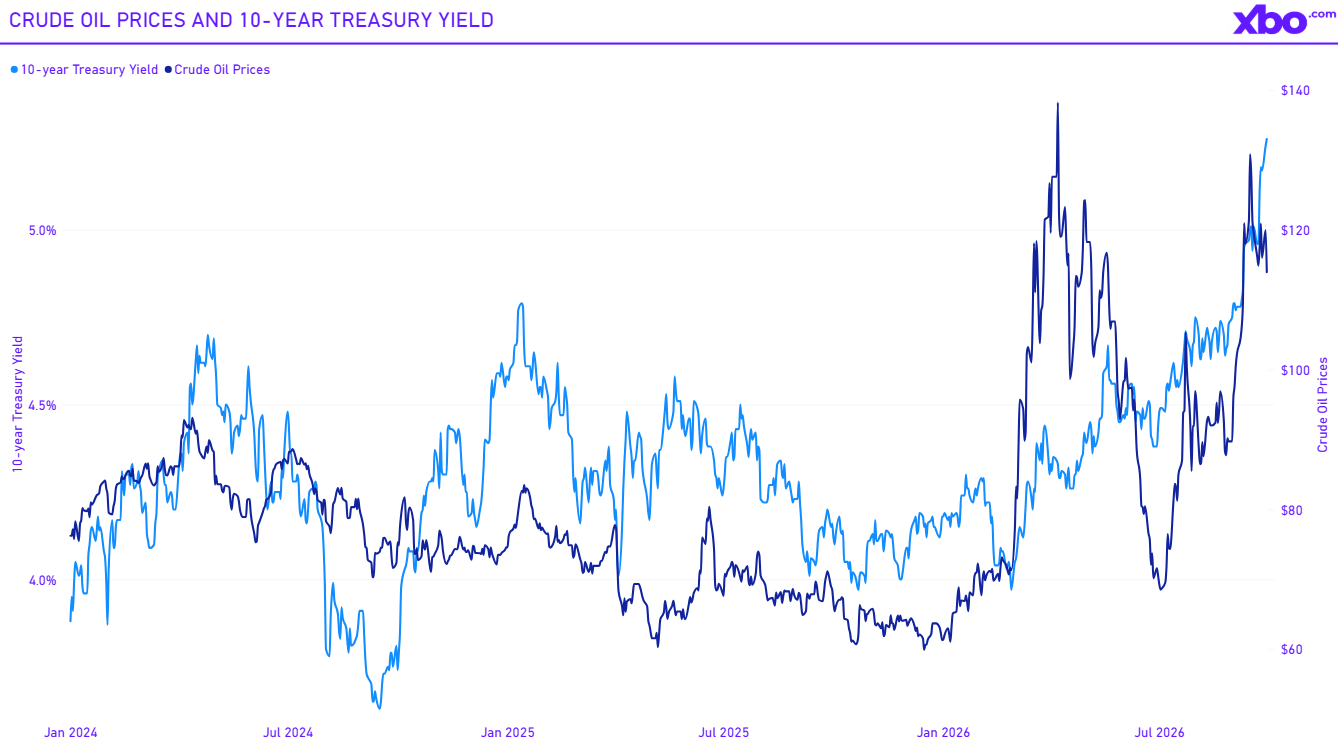
The inflationary impulse was supplied by oil throughout the quarter. With the Strait of Hormuz effectively closed for most of the period, oil roughly doubled (from around $69 in early July to almost $120 by the end of September) and the ten-year Treasury yield tracked it almost step for step: from 4.48% on July 1 to 5.26% by September 29. That is 78 bp at the long end on top of 25 bp at the front.
What matters more is what the long end did not do. In every risk-off episode of the quarter, equities fell and Treasuries failed to rally. This is a hawkish growth scare: the market was pricing inflation risk, which left conventional portfolios without their usual hedge and sent capital looking for assets that are not claims on future dollars.
The quarter’s starting conditions were therefore unambiguous. The discount rate applied to every risk asset rose materially, the policy path was revised higher into 2027, and the standard defensive allocation stopped working. Crypto rose 42.6% regardless. One channel was pulling in the opposite direction, and it came from the Treasury rather than the Fed
3. The Fiscal Channel: The Treasury Buyback That Wasn’t QE
The only thing moving against the current described above in the third quarter came not from the Fed but from the Treasury.
On August 19, the Treasury announced it was at least doubling the size of its buyback operations in nominal long-end coupons, from $2 billion to no less than $4 billion per operation, beginning September 9. When that first expanded operation arrived, the bar turned out to be higher still: the 10–20 year sector operation was announced at $6 billion, three times the previous ceiling. For context: 57 buyback operations were conducted in 2026, against 17 across the entire 22 years before 2023.
The crypto market reacted immediately. Bitcoin rose more than 7% in a single day, from $64,686 to $69,291, wiping out $1.36 billion in short positions against just $49 million in long liquidations (a ratio of 28 to 1). The market read the announcement as covert quantitative easing. That reading was incorrect.
Three Reasons This Is Not QE
Three points settle the question. First, the Treasury does not create reserves, the Fed does. The buyback is funded by issuing Treasury bills, making it a form of liability management rather than monetization: long debt is swapped for short. Second, the stock of debt does not shrink; only its duration changes. Third, and most importantly, the buffer that used to absorb new bill issuance no longer exists.
Source: FRED
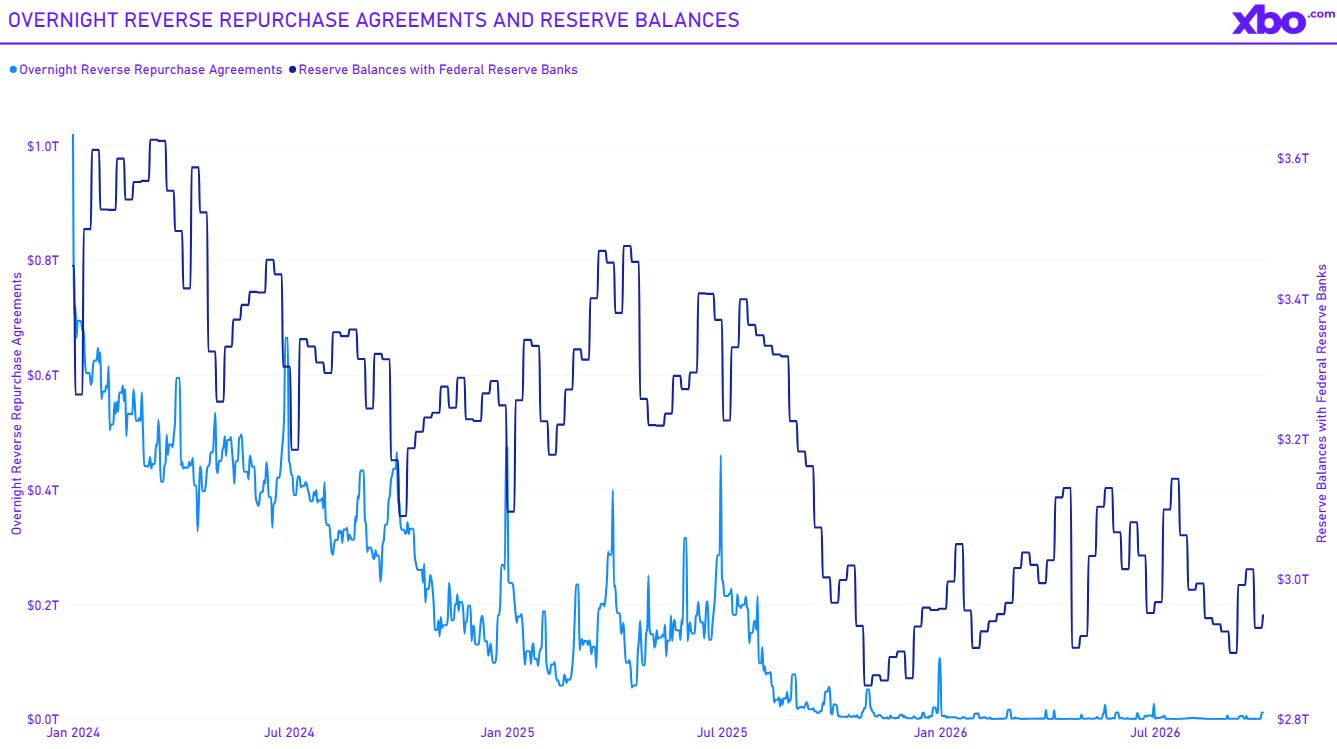
In 2023–2024 the mechanism worked as follows: the Treasury issued bills, money market funds bought them by shifting cash out of the Fed’s reverse repo facility, and bank reserves were left untouched. The RRP balance stood at around $700 billion at the start of 2024, providing enough cushion to absorb issuance with almost no consequences for liquidity.
By Q3 2026 that cushion was fully exhausted. The daily RRP balance in July–September held mostly in the $0.1–2 billion range, with occasional spikes to $5–11 billion on month-end and quarter-end dates. On July 20 it fell to $30 million, a figure statistically indistinguishable from zero. With no remaining capacity to absorb bill issuance other than the banking system, every buyback operation now drains reserves rather than shifting money between Fed accounts.
Reserves confirm this. From $3.14 trillion in mid-July they fell to $2.89 trillion by early September: an outflow of roughly $250 billion in six weeks and the lowest level since autumn 2025. A partial recovery to $2.95 trillion followed by quarter-end, leaving the net position close to where it began. The data does not support the claim that the program added liquidity. The more plausible reading is the opposite: combined with an empty RRP, its net effect was mildly tightening.
What the Yield Data Shows
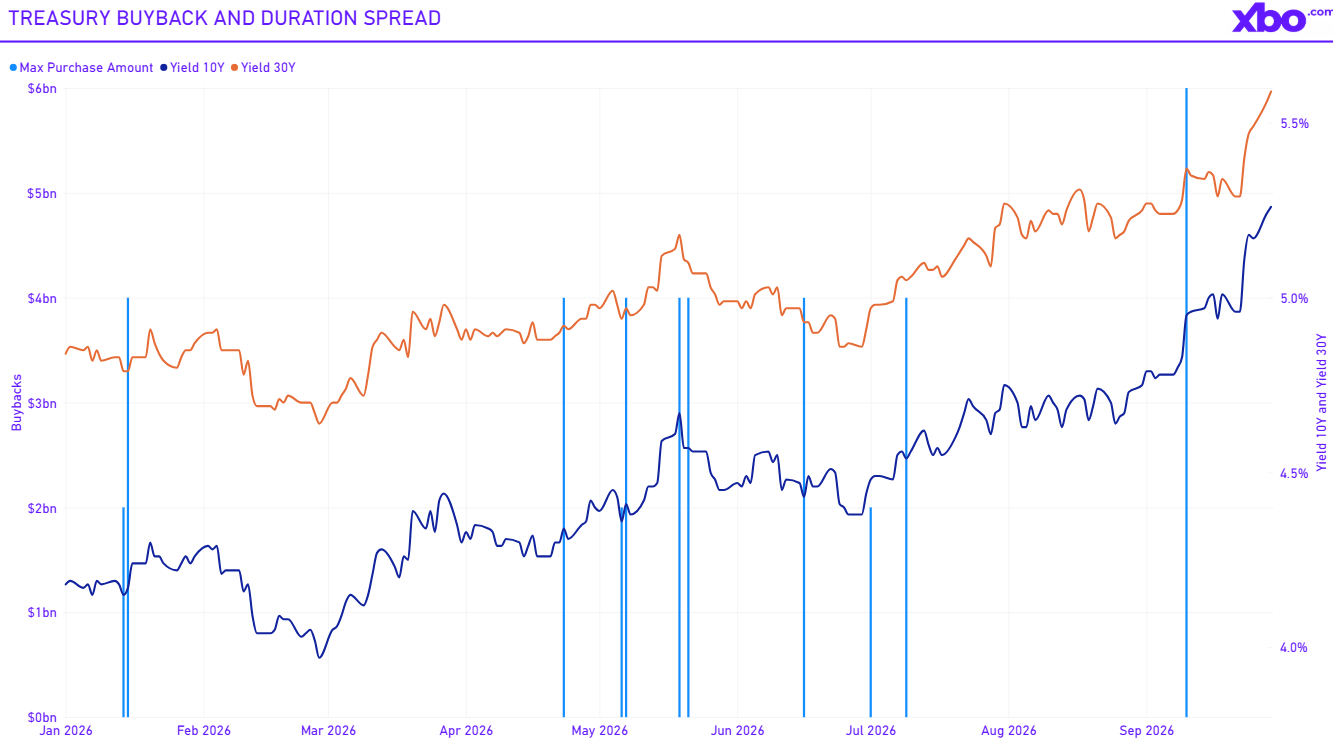
The program had a stated technical objective: to support liquidity at the long end and relieve pressure on dealer balance sheets. Whether long-end yields actually fell is immediately visible in the data.
Source: FRED, U.S. Department of the Treasury
They did not. On the day of the announcement, ten-year yields stood at 4.65% and thirty-year yields at 5.19%. By September 29 they were 5.26% and 5.59% respectively. Over the life of the expanded program, the long end added roughly 40 basis points, closing the quarter at its highs.
The 30Y–10Y spread narrowed from 59 bp in mid-August to 33 bp at the end of September. It is tempting to credit the program for this, but a simpler explanation holds: when the market prices rate hikes, the short and intermediate parts of the curve react more than the long end. This pattern is known as bear flattening. Over the past year, the spread has ranged between 33 and 66 bp, so a 26 bp move most likely reflects that dynamic rather than the buyback’s influence.
The Narrative as the Only Channel That Worked
On August 19, the market interpreted the Treasury’s active yield curve management as a sign that fiscal policy was beginning to counteract monetary tightening. The reading was straightforward: the fiscal side is beginning to outweigh the monetary one, the government has a growing interest in containing debt service costs, and the long-run value of claims on money is in question. For hard assets, that is a bullish argument, and the only one that genuinely appeared that day.
How the market traded it matters. The move began as a short squeeze, but no accumulated leverage was left behind: futures open interest barely changed, at $49.05 billion the day before against $48.92 billion on the day of the move. Closed shorts were replaced by spot buying rather than new borrowed capital. Derivatives joined only later, and what came of that is covered in section five.
The fiscal channel explains the spark and the direction of the narrative. It does not explain why Bitcoin held its gain over the following six weeks, through a hawkish turn at Jackson Hole, a rate hike, and oil near $120. And it did not add money to the system.
If no money was added, that should be visible in the most direct gauge of crypto liquidity.
4. Stablecoins: The Fuel Stopped Leaking but Did Not Come Back
Stablecoins are convenient because they require no assumptions: their supply is the quantity of dollars sitting on-chain and ready to take risk.
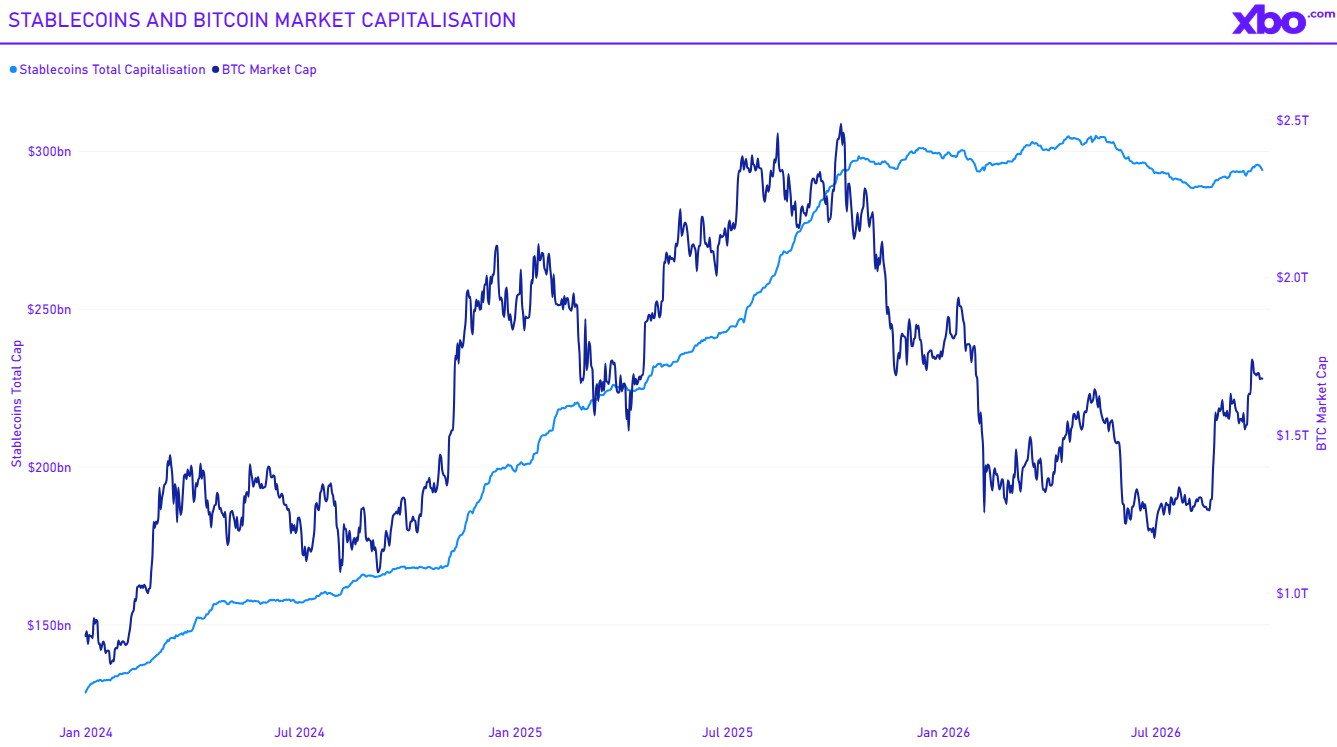
How Stablecoin Supply Moved in Q3
The stablecoin supply data corrects the expectation carried into the quarter. The contraction that began in spring came to a halt in the third quarter.
Aggregate stablecoin supply peaked on May 11, 2026 at $304.8 billion. Over the second quarter, it shrank by $7.3 billion. The third quarter opened at $293.2 billion, fell to a low of $288.3 billion on August 2, and then turned. By September 26, supply had recovered to $295.7 billion, closing the quarter at $294.0 billion. The net change for the quarter came to +$0.8 billion, or 0.3%.
The date of the turn deserves separate attention. Supply began growing on August 19, the very day the Treasury announced the expanded buyback and Bitcoin gained more than 7%. Over the three days from August 18 to 21, stablecoin supply rose by $2.0 billion. Bitcoin’s market capitalization over the same three days rose by $274 billion. That ratio is the substance of this section.
The Scale of the Mismatch
Bitcoin’s market capitalization rose from $1.20 trillion on July 1 to $1.68 trillion on September 30, an increase of nearly $477 billion. Stablecoin supply over the same period added $0.8 billion. Even measured from the August low, the inflow was $5.7 billion against $405 billion of added capitalization, a ratio of roughly 70 to 1.
New dollars physically could not have funded this move. The inflow was enough to support the rally, but not to cause it.
The wider context is also telling. In 2024, stablecoin supply grew 55%, from $128.5 billion to $198.8 billion. In 2025, it grew another 50%, to $297.9 billion. Over the first nine months of 2026, it fell by $3.8 billion. This is the first year without growth in the instrument’s history, and it coincided with the first year of Fed tightening this cycle.
Where the Dollar Moved
Contraction is not the same as capital flight, and that distinction matters.
With the federal funds rate at 4%, holding non-interest-bearing USDT means forgoing 4% a year. For the first time in this cycle, the opportunity cost became material, and money responded to it without leaving the blockchain.
According to RWA.xyz, the market for tokenized U.S. Treasury obligations grew from $9.6 billion at the end of 2025 to $14.8 billion as of June 10, 2026, spread across 82 products, and exceeded $15 billion by the third quarter. Yields on these instruments held in the 4–4.65% range. The largest products, including BlackRock’s BUIDL, Circle’s USYC, and Franklin Templeton’s BENJI, each approached $2.5–3 billion by mid-year.
The dollar stayed on-chain but changed function. It ceased to be trading capital and became savings capital. Money of that kind earns a yield where it sits rather than stepping into risk on a signal. To join a rally, it first has to be actively redirected.
There is a second consequence, to which we return in section six: the risk-free rate has moved on-chain. DeFi lending protocols offering 4–6% now compete with 4.65% from U.S. government debt in tokenized form. The bar that has to be cleared to justify smart contract risk has risen along with the Fed funds rate.
What This Means
The third quarter was not a quarter of liquidity flight. The outflow stopped, and a cautious return emerged in the second half. But the size of that return falls well short of what would have been required to fund a 42.6% rally in Bitcoin.
Two possibilities remain. Either the rally was paid for with leverage, or it was paid for by exhausted supply: practically no sellers were left, and even a modest buying flow was enough to move the price.
This can only be tested from the other side of the order book.
5. Bitcoin: Anatomy of a Rally Without Fuel
The previous three sections eliminated the conventional explanations for the rally. Macro worked against the rally. The fiscal channel supplied a spark and a narrative but no money. Stablecoins confirmed that no new trading dollars entered the system.
One mechanism remains, and in the third quarter it worked at full strength: Bitcoin rose primarily because supply ran out.
The Coins That Are Not for Sale
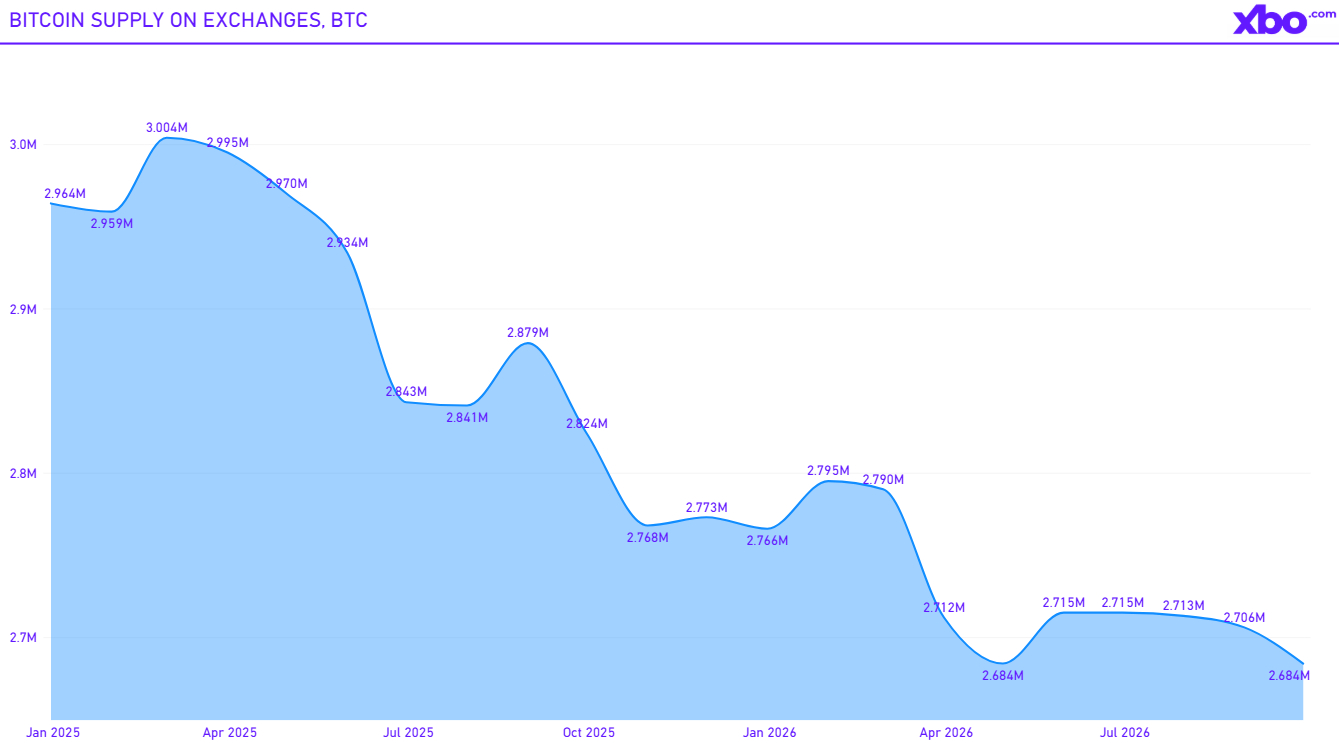
Source: CryptoQuant
The most direct way to measure sellable supply is to look at how many coins sit on exchanges. Over the quarter, exchange reserves fell from 2.715 million BTC to 2.684 million, in a decline of 31,000 coins amid the price rising more than 40%. Since the start of 2026, the outflow has been 82,000 BTC. From the February 2025 peak, when exchanges held 3.004 million, available supply has fallen by 320,000 coins, roughly a tenth of the total.
September’s figure of 2.684 million tied the April low, marking the lowest level recorded across the entire observed period. Coins are leaving trading venues for cold storage on the way up, which is the signature of redistribution into strong hands. That pattern of redistribution is captured in a single declining line on the chart above.
Four Sources of Selling Dried Up at Once
This is arguably the most underrated story of the quarter. The customary suppliers of coins stopped supplying, and they did so almost in unison.
Short-term holders capitulated in July. Over two days, July 14–15, 32,000 BTC were sold at a loss. Weak hands exited at the bottom, exactly as the pattern suggested they would.
Miners stopped being structural sellers. The shift into AI and HPC is changing the economics of the industry: compute revenue as a share of public miners’ income is rising from roughly 30% to 70% by year-end, according to S&P Global’s estimate. TeraWulf secured a $19 billion Anthropic contract, CleanSpark reached $6.6 billion, and Hyperscale fully retired its mining fleet for a $1.2 billion contract. Miners accounted for only 8.2% of Bitcoin’s gain, meaning they did not sell even at a convenient price.
Strategy completed a full cycle. In early July, the company sold 3,588 BTC, reducing its position for the first time in its history. In late August it returned to buying, acquiring 4,603 BTC at an average price of $80,318. The marginal seller at the bottom became a buyer at the highs.
Whales accumulated. Large-holder wallets added 46,420 BTC between June and early August, and a further 39,154 BTC in the single week of August 23–28.
The Buyer That Will Not Sell
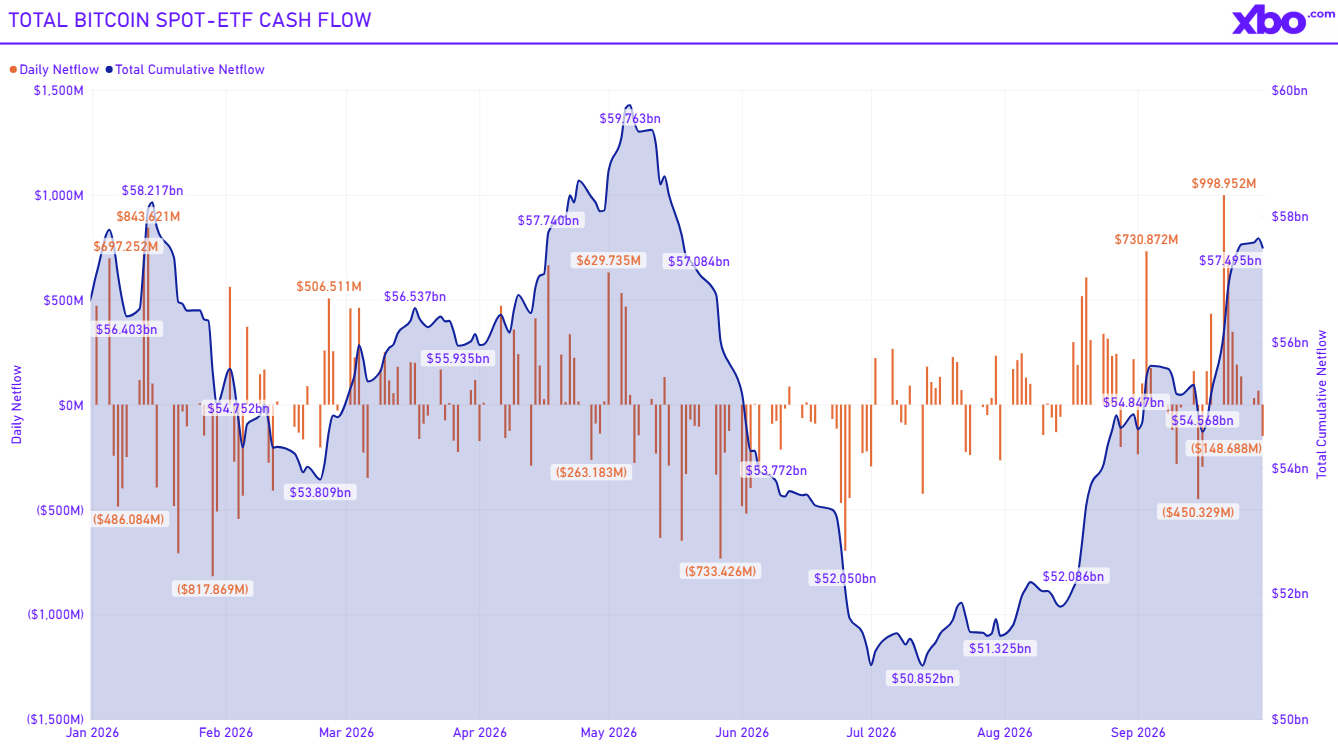
Source: Sosovalue.com
On the demand side, the quarter looks considerably stronger than is generally assumed.
ETFs closed the second quarter with $4.97 billion of outflows. Cumulative inflows since launch fell from $56.12 billion at the end of March to $51.15 billion at the end of June, with the low of $50.85 billion on July 1. That was the turning point.
The recovery was swift. July was nearly flat at +$172 million, but August brought +$3.52 billion and September +$2.65 billion, for a quarterly total of $6.34 billion in net inflows. That fully offset the second-quarter decline and lifted the cumulative figure to a new high of $57.50 billion.
Two details make this number meaningful. First, net inflows since the start of 2026 amount to only $883 million, meaning the year remains close to flat for ETFs and the entire result was produced in a single quarter. Second, the largest daily inflow of the year, $999 million, came on September 21, five days after the rate hike. Institutional demand did not merely hold through the tightening but rather accelerated into it.
A structural feature of the channel is IBIT’s dominance, accounting on some days for 75% to 100% of the entire daily flow. This is no longer a market of eleven funds but effectively one channel with ten satellites. Such concentration cuts both ways: inflow is steady as long as one distributor is working, and vulnerable if it stops.
Who Was Actually Buying: Spot Against Leverage
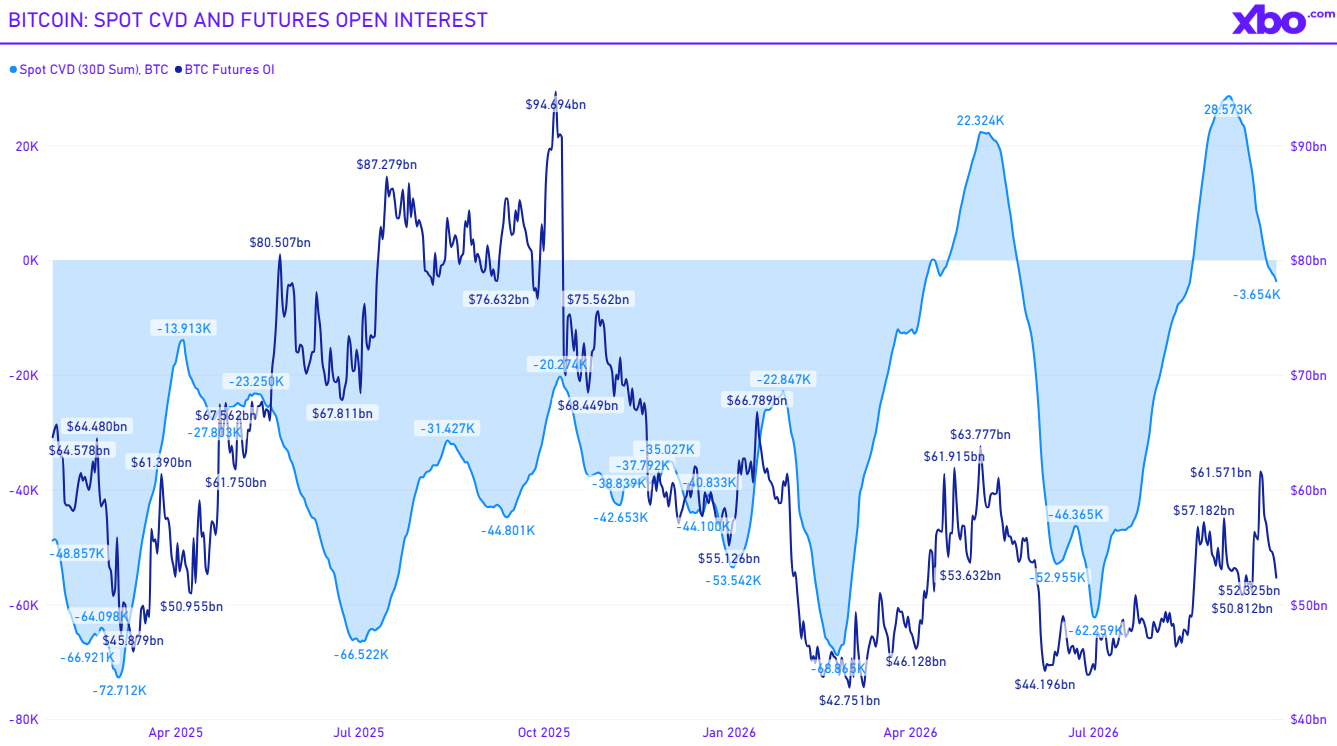
Source: Checkonchain
This chart shows which way participants were aggressive in the underlying market and how much leverage was standing behind it. The quarter splits into four regimes.
July: absorption. Spot delta on July 1 stood at minus 62,103 BTC, a deep low inherited from the June collapse. All month, aggressive sellers hit the bid, yet the price rose from $59,963 to $65,213. Open interest was flat at $44–48 billion. This is the classic signature of absorption: supply pours into the market and is absorbed by passive limit orders. By the end of July, the delta had recovered to minus 24,413, close to 38,000 BTC of absorbed selling in a month.
August 19: a squeeze paid for in spot. The move was triggered by $1.36 billion of short liquidations against $49 million of longs. The decisive difference from a typical squeeze is what was left behind. Spot delta added 2,354 BTC on the day, while open interest did not move: $49.05 billion the day before, $48.92 billion on the day itself. The shorts being closed were replaced by real spot buying rather than fresh leverage. The fiscal narrative was bought with actual money, which is precisely why the gain held.
August 20 to September 6: the healthy phase. Leverage joined next. Open interest rose by $7.8 billion in three days, to $56.76 billion by August 22. Spot delta rose alongside it and on August 20 turned positive for the first time since April, peaking at +28,573 BTC on September 6. Buying was happening in spot and in derivatives simultaneously. This is the only stretch of the quarter when the rally was confirmed from both sides, and it is the stretch that carried Bitcoin to $80,000.
September 19–22: a rally on leverage alone. Open interest exploded from $51.11 billion to $61.57 billion, a gain of $10.5 billion in four days and the largest increase of the period. Spot delta over the same days fell from 15,305 to 5,963. The price reached $86,833, the high of the year. The structure of the move is the inverse of August’s: derivatives pulling up, spot selling.
The resolution came immediately. Over the next eight days, open interest collapsed by $9.2 billion to $52.33 billion, and the price retraced to $83,727. Leverage delivered the impulse and took it straight back, exactly what did not happen in August.
A Stress Test
Mid-September provided a natural experiment. In a single week, the market absorbed a hot CPI print, a rate hike, the failure of the CLARITY Act, and $746 million of ETF outflows concentrated on September 15–16.
The decline was 2.1%, and the $75,000 level held. Spot delta over those days fell from 21,586 to 17,298, indicating substantial aggressive selling was present. The price withstood it.
Had supply not passed into structurally immobile hands, that combination should have produced a far deeper correction. However, it did not.
What This Means for the Rest of the Market
The rally was funded by the absorption of aggressive selling against physically shrinking supply rather than by an influx of new buyers. Demand appeared in bursts, three times in the quarter, and each time faded quickly. What sustained the move was the absence of offsetting supply.
This conclusion has a direct corollary: the mechanism does not scale. Bitcoin has an ETF channel, corporate treasuries, miners who moved into a different business, and a completed cycle of redistribution into strong hands. Altcoins have none of this at a comparable scale.
6. Crypto Market Sectors: Where Capital Held Up, and Why
The previous section implied that sectors would mostly underperform Bitcoin. The opposite happened: six of the seven sectors outran it, and the gap between the best and the worst reached 87 percentage points. This is consistent with the aggregate picture as well: the altcoin basket added 48.4% for the quarter against Bitcoin’s 42.6%, beating it for the first time in five quarters.
To understand what produced this, the quarter has to be split into two halves, as they are constructed in fundamentally different ways.
We track seven sectors built from coins listed on XBO. Each sector contains a comparable set of leading assets; weights are calculated from the square root of market capitalization with a cap on any single asset’s share; and the selection and weighting rules are identical across all of them. This makes the sectors directly comparable to one another.
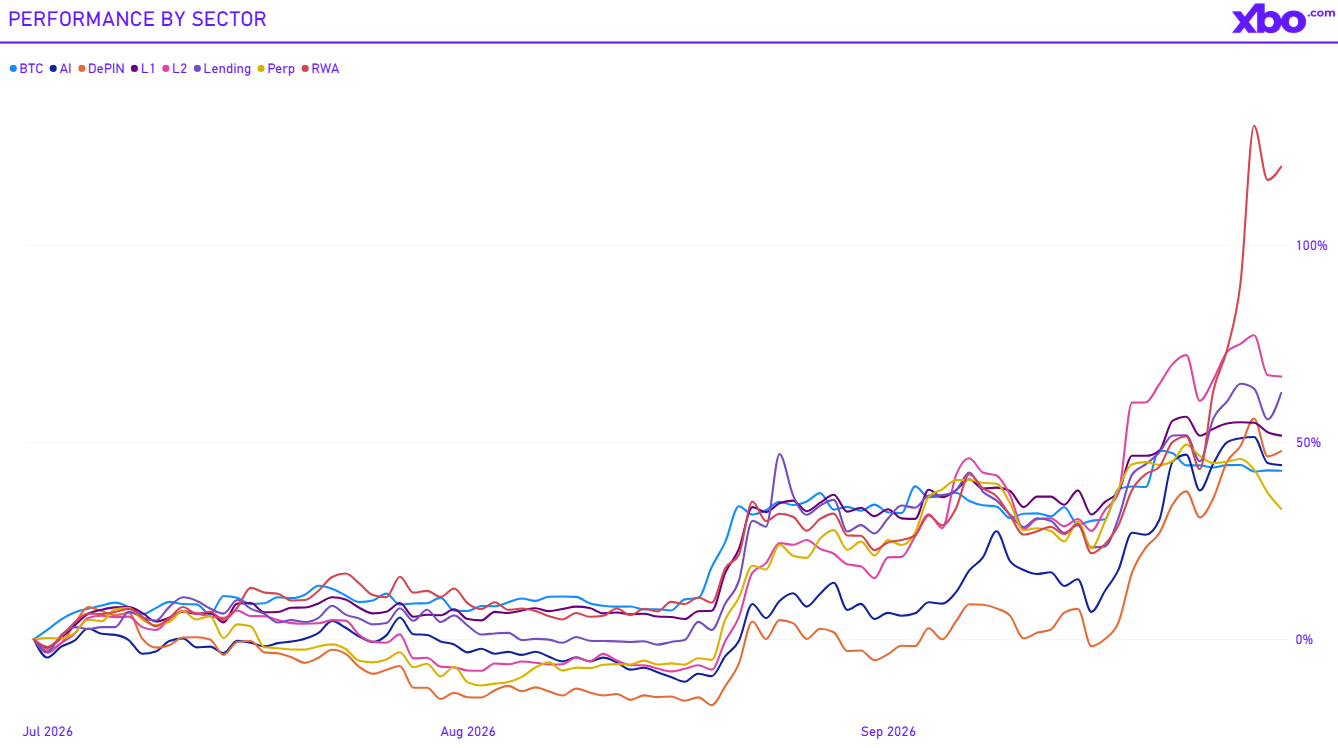
Source: XBO
The First Half: a One-Asset Market
Until August 18, the crypto market consisted of Bitcoin and everyone else.
By that date, Bitcoin was up 10.5%. Of the seven sectors, only three were positive: RWA (+10.6%), L1 (+7.1%), and Lending (+4.4%). The other four were in the red: L2 -6.6%, Perp -4.8%, AI -8.8%, DePIN -14.7%.
This is precisely the picture described in section five. Exhausted supply worked for Bitcoin and for nothing else. There was no capital capable of lifting the broad market, and so it did not lift. For six weeks the market moved strictly in a single asset.
The Second Half: a Catch-Up Rally
From August 19, everything changed. Over the remaining six weeks, every sector without exception outran Bitcoin, which added a further 29%.
|
Sector |
To 18 August |
After 18 August |
Full quarter |
|
RWA |
+10.6% |
+98.8% |
+119.8% |
|
L2 |
-6.6% |
+78.3% |
+66.6% |
|
Lending |
+4.4% |
+55.6% |
+62.4% |
|
L1 |
+7.1% |
+41.6% |
+51.6% |
|
DePIN |
-14.7% |
+73.2% |
+47.7% |
|
AI |
-8.8% |
+58.0% |
+44.1% |
|
Perp DEX |
-4.8% |
+39.8% |
+33.0% |
|
BTC |
+10.5% |
+29.2% |
+42.7% |
The pattern is clear: the deeper a sector fell in the first half, the more it rose in the second. DePIN was the worst performer before August 19 and the third best after. L2 was fifth and became first. This is the mechanical recovery of the oversold (beta, in other words), rather than capital choosing between strong and weak narratives.
Exactly one sector falls outside the general rule.
RWA: The Only Sector That Led in Both Halves
Real-world asset tokenization was the third strongest sector before August 19 and the strongest after. It was not recovering from a slump, because there was no slump: its maximum loss relative to the start of the quarter was 1.9%, smaller than any other sector’s.
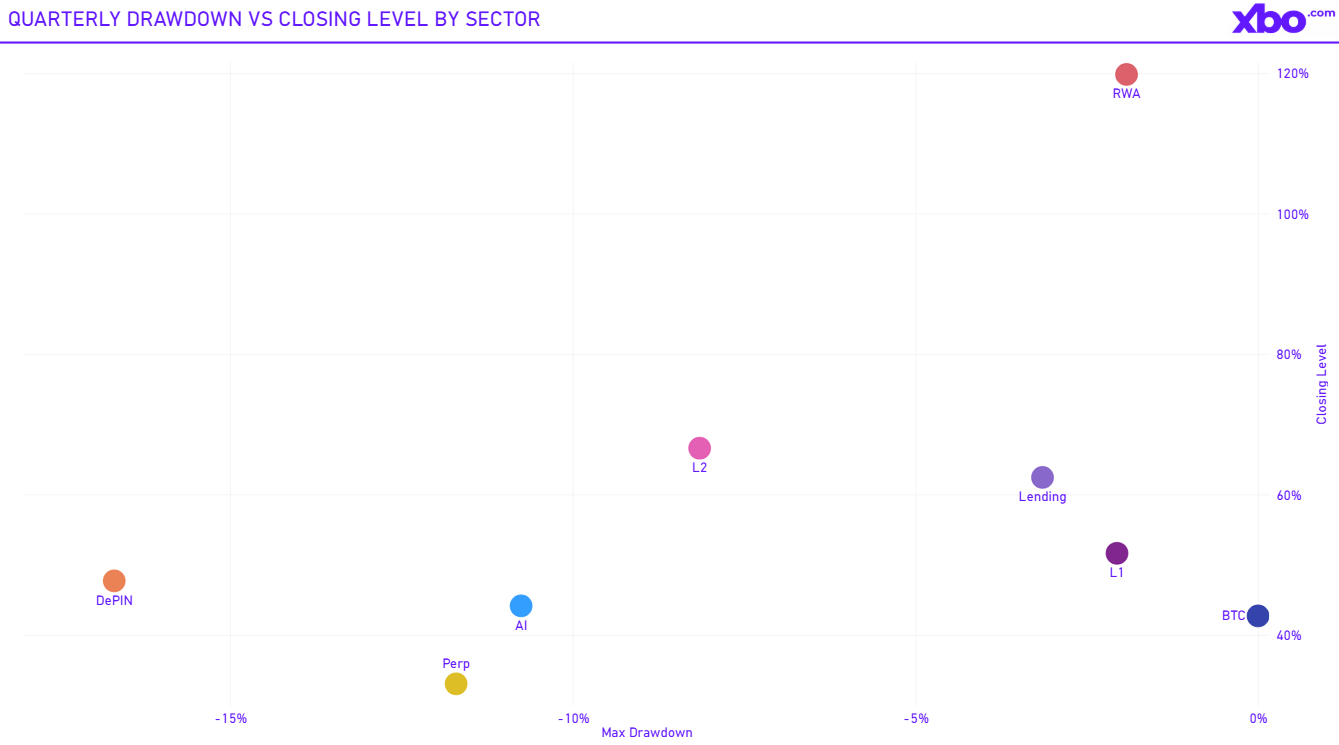
Source: XBO
The chart makes this plain: RWA sits alone in the upper right corner, with maximum return at minimum loss. The other sectors line up along a diagonal down and to the left, where higher returns were paid for with deeper drawdowns.
The reasons lie outside the crypto market and are examined in the next section, but the essence is that this is the only sector that received concrete regulatory developments in the third quarter rather than promises: tokenized equities gained an exemption, transfer agent rules were rewritten for the first time in forty years, the Arc settlement network launched with BlackRock, Visa, and DTCC among its validators, and S&P acquired OpenZeppelin. The market for tokenized assets excluding stablecoins approached $38 billion, and the number of holders rose to 2.3 million, up 70% in a month.
One caveat is essential. More than half of RWA’s quarterly result came in the last week of September: from +43.6% on September 21 to +130.2% on September 28. A vertical move of that magnitude in a sector where one asset carries 40% of the weight almost certainly reflects one or two instruments rather than a repricing of the whole theme. This result should be treated as a single event rather than evidence of a durable trend.
Perp DEX: The Weakest Sector of the Quarter
Perp DEX presents the sharpest contrast with RWA and the most unexpected result of the quarter. Despite having the strongest and most direct revenue stream in crypto (perpetuals volume at Hyperliquid of roughly $240 billion over thirty days, PURR’s $1.9 billion treasury, the HIP-4 launch), the sector finished last.
The weakness was not broad-based: on September 23, Perp DEX stood at +49.3%, above Bitcoin. Everything happened in the final week, when the sector gave back a third of what it had gained.
This connects directly to the mechanics described in section five. Between September 19 and 22, futures open interest rose by $10.5 billion while spot delta was falling, then collapsed by $9.2 billion over eight days. A sector whose value is tied directly to leveraged trading suffered more than any other from the unwinding of that leverage. Revenue protects against fundamental deterioration, but not against the temporary drying up of its source.
What This Means
The original hypothesis that in a quarter without new capital the distribution between sectors becomes a zero-sum game was confirmed only partly, and not in the way expected.
There was no zero-sum between sectors: all of them rose. But no new capital appeared either, as section four showed. The money for the second half of the quarter came from two sources, both visible in the data. The first is rotation out of Bitcoin: in the second half, it lost to all seven sectors, meaning capital was flowing out of it rather than being added from outside. The second is leverage, and the September surge in open interest followed by its collapse shows how much of the rally was built on borrowed capital.
From this comes a working test of resilience. Third-quarter return says almost nothing about the quality of a sector: it mostly measures how deeply that sector had fallen before August 19. Two other markers are informative: whether the sector led in both halves of the quarter, and what drawdown it paid for the result. On both counts, exactly one sector came out ahead, and it won on regulatory certainty rather than revenue or narrative.
7. Regulation as the Allocator of Capital
In the third quarter, the winner was not the sector with the better economics but the one granted the right to operate. Here is how that right was handed out.
The Law Did Not Pass
On September 15, the CLARITY Act failed in the Senate by 49 to 50. Not a single Democrat supported the bill. As recently as May, prediction markets put its chances at 75%; by September, the estimate had fallen to 10%.
Substantively, the vote was derailed by three issues, none of which concerned market structure: conflicts of interest and ethics restrictions, the permissibility of yield on stablecoins, and protections for developers of non-custodial software. The crypto market was waiting for a framework law and received a reminder that the question remains political rather than technical.
For the broad altcoin market, this was the main negative outcome of the quarter. CLARITY was precisely what was meant to deliver what most tokens lack: certainty about their status. It did not arrive.
The Agencies Took Over the Agenda
The third quarter turned out to be the most productive in the history of U.S. crypto regulation, though the result did not come from Congress.
The SEC and the CFTC moved the agenda into rulemaking, where no Senate vote is required. Over the quarter, the following took shape. Regulation Crypto Assets was established as a disclosure framework. A five-year Innovation Exemption was introduced for tokenized national exchange equities. Transfer agent rules were rewritten for the first time in forty years to accommodate on-chain registries. A CFTC track was created for crypto derivatives venues. BTC, ETH, SOL, and XRP were officially classified as digital commodities.
This explains the sector performance described in section six. Regulators were issuing permissions to specific types of infrastructure (settlement, recordkeeping, custody) rather than to the market at large. Real-world asset tokenization received everything: the right to issue tokenized equities, a legal way to maintain a register of holders on-chain, and status for the underlying assets. The perpetuals market received a CFTC track but no timeline. Lending protocols, L2s, and DePIN received nothing, because their central question, the status of the token, was being resolved in CLARITY.
The asymmetry is structural rather than accidental: agencies can authorize an activity, but they cannot change the definition of a security. As a result, infrastructure received specifics and tokens did not.
What This Promises and What It Does Not
This approach to regulation has a flaw worth naming directly. JPMorgan analysts put it most precisely in September: agency rules are less durable than legislation, and the next administration can repeal them the same way they were adopted. Institutional capital building ten-year products understands this, which is exactly why inflows into RWA come from those who can carry regulatory risk rather than from the broad market.
Europe, meanwhile, was solving a different problem. MiCA works as a consolidator: of more than three thousand firms, roughly 280 obtained licenses, and the market narrowed to those able to bear compliance costs. Qivalis brought 37 European banks onto public Ethereum, Hong Kong launched HKDAP, and Germany fixed its crypto tax at 25%. The underlying logic was consistent across all of them: regulatory certainty came at the price of market selection.
Based on the above, it could be concluded that in the third quarter, capital went where the rules were clearer rather than where the economics were better. Until CLARITY returns to the agenda, this principle of allocation will remain in force, and it will work in favor of a narrow circle rather than the market as a whole.
8. Institutional Infrastructure: The Pipe the Money Will Flow Through
The third quarter brought almost no institutional money. What it did do was build almost everything that money will be able to arrive through. The gap between the two is the main thing to understand about this section: what follows affects not Q3 2026 but the whole of 2027.
The Banks Arrived in Groups
Individual banks had entered crypto before. What is new in the third quarter is that they stopped entering one at a time.
The BankChain Alliance brought together 3,283 banks with combined assets of $21.8 trillion. Cari assembled more than 30 banks with $10 trillion. Qivalis brought 37 European banks onto public Ethereum. U.S. Bank launched its own deposit token, USBDC, on Stellar; Deutsche Bank opened a custody service; Block filed for a banking charter; OpenReserve began operating.
The consortium form matters more than the scale. A bank inside an alliance of three thousand participants is not making a decision about its own risk but deciding to follow an industry standard. That moves participation out of the category of experiment and into the category of infrastructure, and infrastructure is not switched off at the first drawdown.
The settlement layer took shape in a similar way. The launch of the Arc network produced eleven institutional validators. A few of them (BlackRock, Visa, DTCC, and other institutional partners) function as market infrastructure rather than market participants. When a clearing organization validates blocks, that represents a different category of involvement than buying an asset onto a balance sheet.
Treasuries Changed Their Behavior
The corporate segment went through a double transformation over the quarter. The sector of public companies holding crypto on their balance sheets reached a market capitalization of around $340 billion but changed qualitatively.
The first change is composition. Some companies moved from Bitcoin and Ethereum to altcoins: PURR with a $1.9 billion treasury, StablecoinX with 3 billion ENA tokens, CYPH with ZEC and a 142% gain. The second is behavior: from passive holding to active yield management, with SharpLink deploying $200 million through Lido.
In the context of section five’s findings, this had a direct consequence: corporate selling of Bitcoin stopped and Strategy returned to buying. Looking ahead, the implications go further: the treasury model has ceased to be a bet on one asset and became an instrument capable of redirecting flows between sectors. That is precisely the rotation mechanism that will be needed if liquidity inflows resume in the fourth quarter.
The Other Side
The infrastructure under construction demonstrated its weak points reliably throughout the third quarter. Liquid Network lost around $320 million, or 3,400 BTC, which were subsequently recovered. Coldcard lost $89 million, BonkDAO $20 million, and Summer.fi $6 million. Ledger reorganized its security function against a backdrop of $1.4 billion of industry losses over the year.
The failures followed a consistent pattern. The base blockchains held; it was the federated and bridge layers that gave way, precisely the components responsible for connecting networks to each other and to the outside world. Institutional architecture is built out of exactly such connections, and this is its systemic risk rather than an isolated misfortune for individual projects.
When This Switches On
The defining property of all this is its deferral. The GENIUS Act’s stablecoin requirements take effect from January 2027. Banks plan to launch tokenized deposits in 2027. The Innovation Exemption runs for five years.
This means the demand built in the third quarter will switch on according to the regulatory calendar rather than a market signal. It will not arrive sooner if Bitcoin rises, and it will not disappear if Bitcoin falls. Nothing follows from this section for the fourth quarter, and that is its main conclusion: the institutional layer no longer depends on what is happening to the price.
What Comes Next: An Outlook on the Fourth Quarter
The third quarter ended in an unusual position. Bitcoin gained 42.6% with the Fed tightening, zero stablecoin inflows, and a defeated bill. In other words, it rose in defiance of everything conventionally treated as a condition for growth. That makes forecasting a questionable exercise: a model that explains the quarter that just ended would by definition not have predicted it.
What follows is therefore not a forecast but an account of how the market and the analytical community view the fourth quarter, together with the observable measures that would confirm or refute each position.
What the Market Itself Is Pricing
The most reliable reference point is not opinions but quotes.
At the end of September, Fed funds futures put the probability of a hike at the October meeting at 68.6%, and the probability that by the December meeting the rate would be at 4.25–4.50% or higher at 54.6%. In other words, the market considers a scenario with two additional hikes more likely than one with a single hike or none.
The Fed’s dot plot says the same thing: the median path has been lifted to 4.1% for both end-2026 and end-2027, and 16 of 18 participants expect at least one more increase.
This is the default base case, fixed in prices rather than in anyone’s opinion. The price of money continues to rise in the fourth quarter.
Three Views on What Follows from That
Position one: tightening has stopped working as a constraint. Proponents of this view rest on the strongest observation of the quarter: the week of September 15–17, when the market absorbed a hot CPI print, a rate hike, the CLARITY failure, and ETF outflows, and lost only 2.1%. The logic runs as follows: the redistribution of supply into structurally immobile hands is complete, exchange reserves are at a historic low, and there are practically no sellers left. With that structure, macro affects volatility but not direction.
This is straightforward to test. If the thesis holds, exchange reserves will keep falling below 2.684 million BTC, and ETF inflows will stay positive through every hawkish surprise, as happened on September 21, when the largest daily inflow of the year came five days after a rate hike.
Position two: the rally was borrowed from the future. The opposing view points to the structure of the September rally. Over four days, from September 19 to 22, futures open interest rose by $10.5 billion while spot delta was falling, then collapsed by $9.2 billion over eight days. Bitcoin ultimately retraced from $86,833 to $83,727, and Perp DEX, the most leverage-sensitive sector, gave back a third of its quarterly result.
It follows that part of the levels reached is held up by borrowed positions rather than ownership. The test indicator is the behavior of open interest: a steady decline while the price holds would confirm the market’s health, while another spike without rising spot delta would repeat the September pattern.
Position three: the main risk sits outside crypto. This view draws attention to the fact that inflation in the third quarter stayed in the production circuit rather than the consumer one, and that Warsh tied this directly to AI investment. If AI capital expenditure slows, whether because of margin compression, questions about the reflexivity of vendor financing, or the debt leverage inside those investments, the consequences would reach crypto through three channels at once: a general repricing of risk, the miners that pivoted to compute contracts, and the AI token sector.
What should be tracked here is not AI token prices, which behaved like ordinary beta over the quarter, but the reporting of hardware suppliers and the terms of new capacity contracts.
What Is Expected from the Regulatory Track
This is where opinions diverge least. After CLARITY’s failure, the consensus shifted to the view that certainty over the coming quarters will come from agencies rather than Congress, meaning infrastructure will continue to win over tokens as a class.
The caveat repeated most often was formulated by JPMorgan analysts: agency rules are less durable than legislation and can be repealed the same way they were adopted. For capital with a long horizon, this means the regulatory premium the RWA sector earned in the third quarter is not permanent.
The calendar for the coming quarters is known in advance: the GENIUS Act’s requirements take effect from January 2027, bank tokenized deposits are planned for 2027, and the Innovation Exemption runs for five years. These dates do not depend on market conditions.
The Condition That Could Change Everything Else
One measure deserves to be singled out, because it determines whether the crypto market remains a one-asset story.
The third quarter showed two phases: before August 19, only Bitcoin rose; after it, every sector rose, the more so the deeper it had fallen beforehand. That second phase was driven by rotation out of Bitcoin and leverage rather than by new capital entering the market. Stablecoin supply added $0.8 billion over the quarter while Bitcoin’s market capitalization rose by $477 billion.
The key observable therefore remains net stablecoin issuance. The turn from $288.3 billion in early August to $294.0 billion at the end of September is the first move in the right direction in two quarters, but its scale does not yet permit talk of a regime change. If issuance returns to the pace of 2024–2025, when it grew 50% a year, a broad rally becomes possible without relying on leverage. If it stays flat, the market will keep redistributing the same liquidity between sectors, and performance gaps on the scale of the third quarter’s 87 percentage points will become the norm rather than an anomaly.