Q1 2026 Outlook: External Shocks, On-Chain Signals, and Key Assets
Key Takeaways from Q1 2026
• Q1 2026 was one of the worst first quarters for the crypto market in recent years.
• Bitcoin dropped 22%, Ethereum fell 29%.
• Total market capitalization decreased from $2.93 trillion to $2.32 trillion.
• The Fear & Greed Index spent a record 46 consecutive days in the extreme fear zone.
• The main drivers of the decline were the Fed's hawkish stance, the geopolitical shock from the conflict with Iran (oil surged above $100), and the lack of clarity on monetary policy easing.
• Despite the sharp price drop, the fundamental indicators remained resilient: long-term holders were actively accumulating, BTC exchange reserves hit multi-year lows, DeFi TVL stayed stable, and stablecoin capitalization approached $300 billion.
• Institutional infrastructure remained intact.
• The quarter ended not with capitulation, but with "spring compression" – the market cleared excessive leverage and is now positioned for a sharp move in either direction, depending on how the Iran situation and the Fed's policy evolve.
Crypto Market in Q1 2026: The Weakest First Quarter in Years
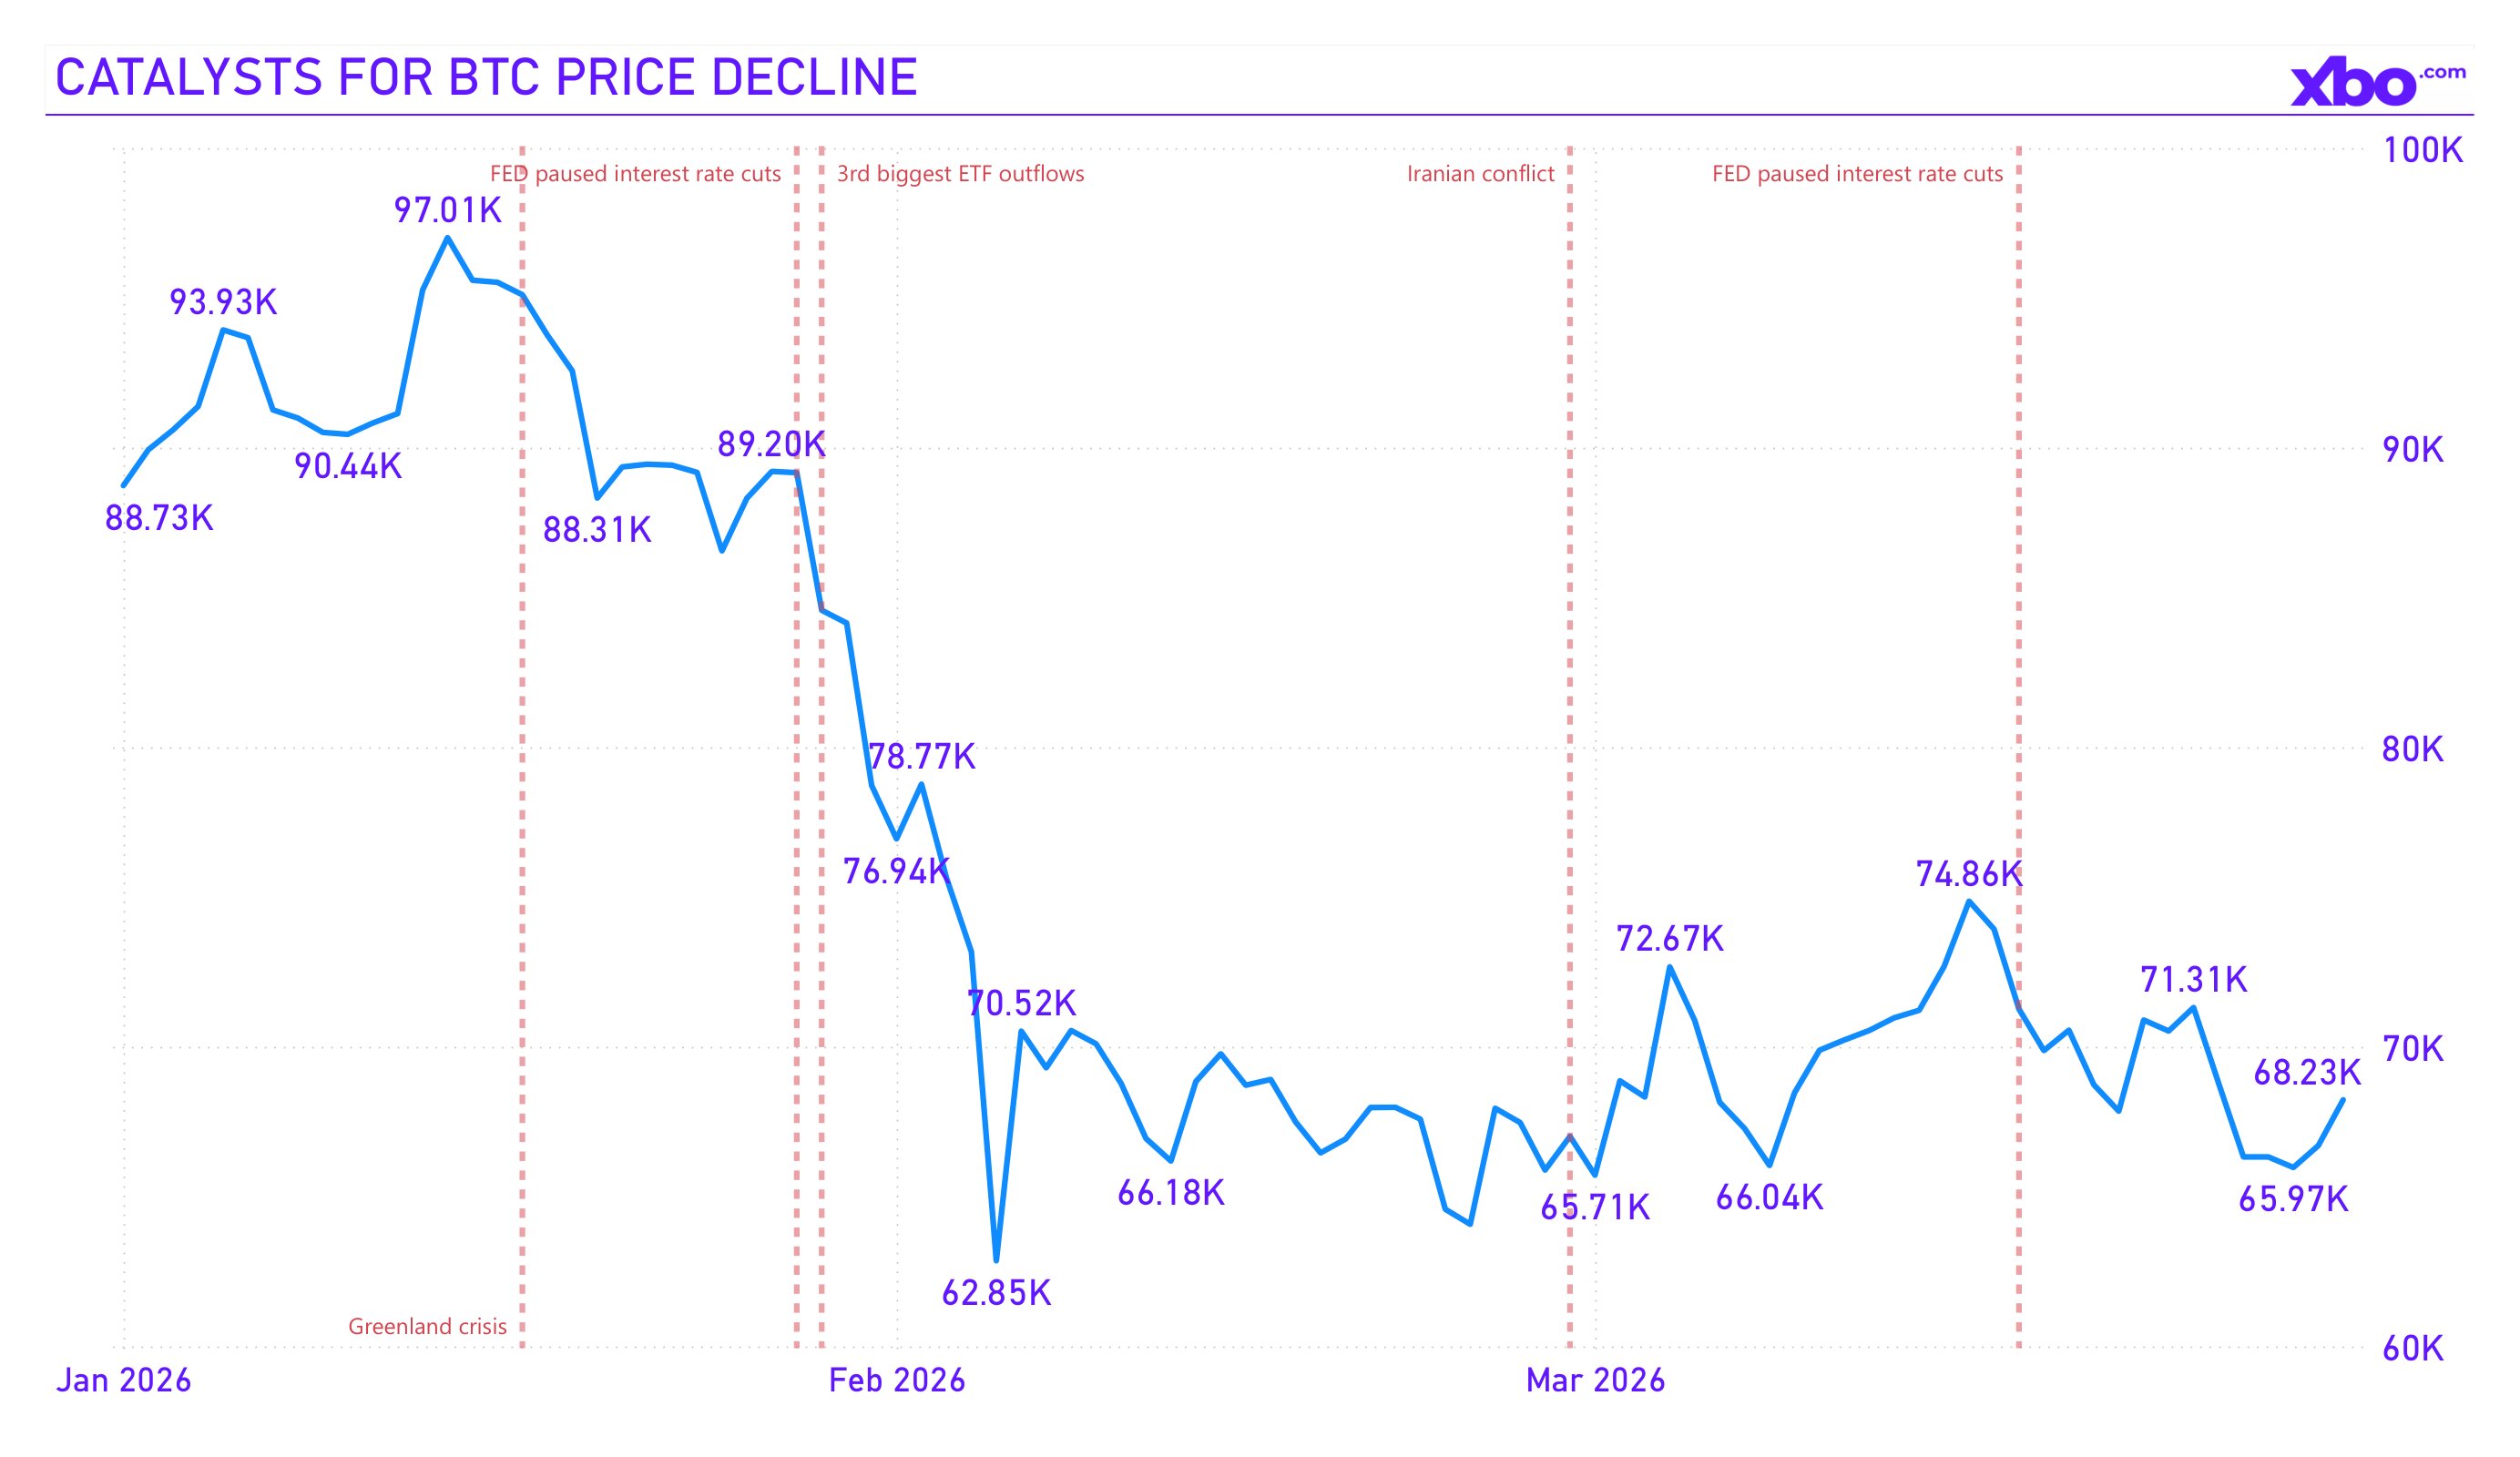
The first quarter of 2026 will go down as one of the most difficult starts to a year in crypto history. A market that entered January with cautious optimism and hopes for a continuation of the bull cycle found itself deep in fear territory by the end of March, experiencing pressure from multiple fronts simultaneously: geopolitical conflict, the absence of Fed rate cuts, and an oil market shock. What still looked like a "healthy correction" in December had begun to resemble a full-blown crisis of confidence by March.
Bitcoin opened 2026 near the $87,500–$88,000 level, continuing its compression phase following the October 2025 peak, when the price reached an all-time high of approximately $126,000. By the end of the first quarter, BTC was trading around $68,200, corresponding to a quarterly return of approximately −22%. According to CoinGlass data, this was the third-worst first quarter for Bitcoin since tracking began, with only Q1 2018 and Q2 2022 recording steeper declines.
Ethereum also showed dismal performance: its quarterly return was −29%, making it the third-worst Q1 for ETH since 2016. For comparison, Ethereum's historical average first-quarter return is +66.45%, with a median of +4.37%. The deviation from historical norms was striking.
Source: tradingview.com
The quarter can be roughly divided into three phases, each driven by its own set of catalysts:
1) January: A slow slide
The year began with attempts to stabilize in the $85,000–$92,000 range. The market was digesting the consequences of record outflows from crypto ETFs in November–December 2025 and continued to adapt to a tighter-than-expected Fed stance. On January 28, the Federal Reserve left rates unchanged at 3.50–3.75% during the first meeting without a cut after three consecutive cuts in 2025. The market still held out hope for a resumption of the easing cycle. However, by the end of January the situation deteriorated sharply: on January 29, nearly $1 billion was withdrawn from BTC and ETH ETFs in a single session, which became the largest single-day outflow since November. Bitcoin broke below $85,000 and briefly touched $81,000. Speculation around the nomination of Kevin Warsh as the next Fed Chair intensified concerns about tighter monetary policy.
2) February: Geopolitical shock
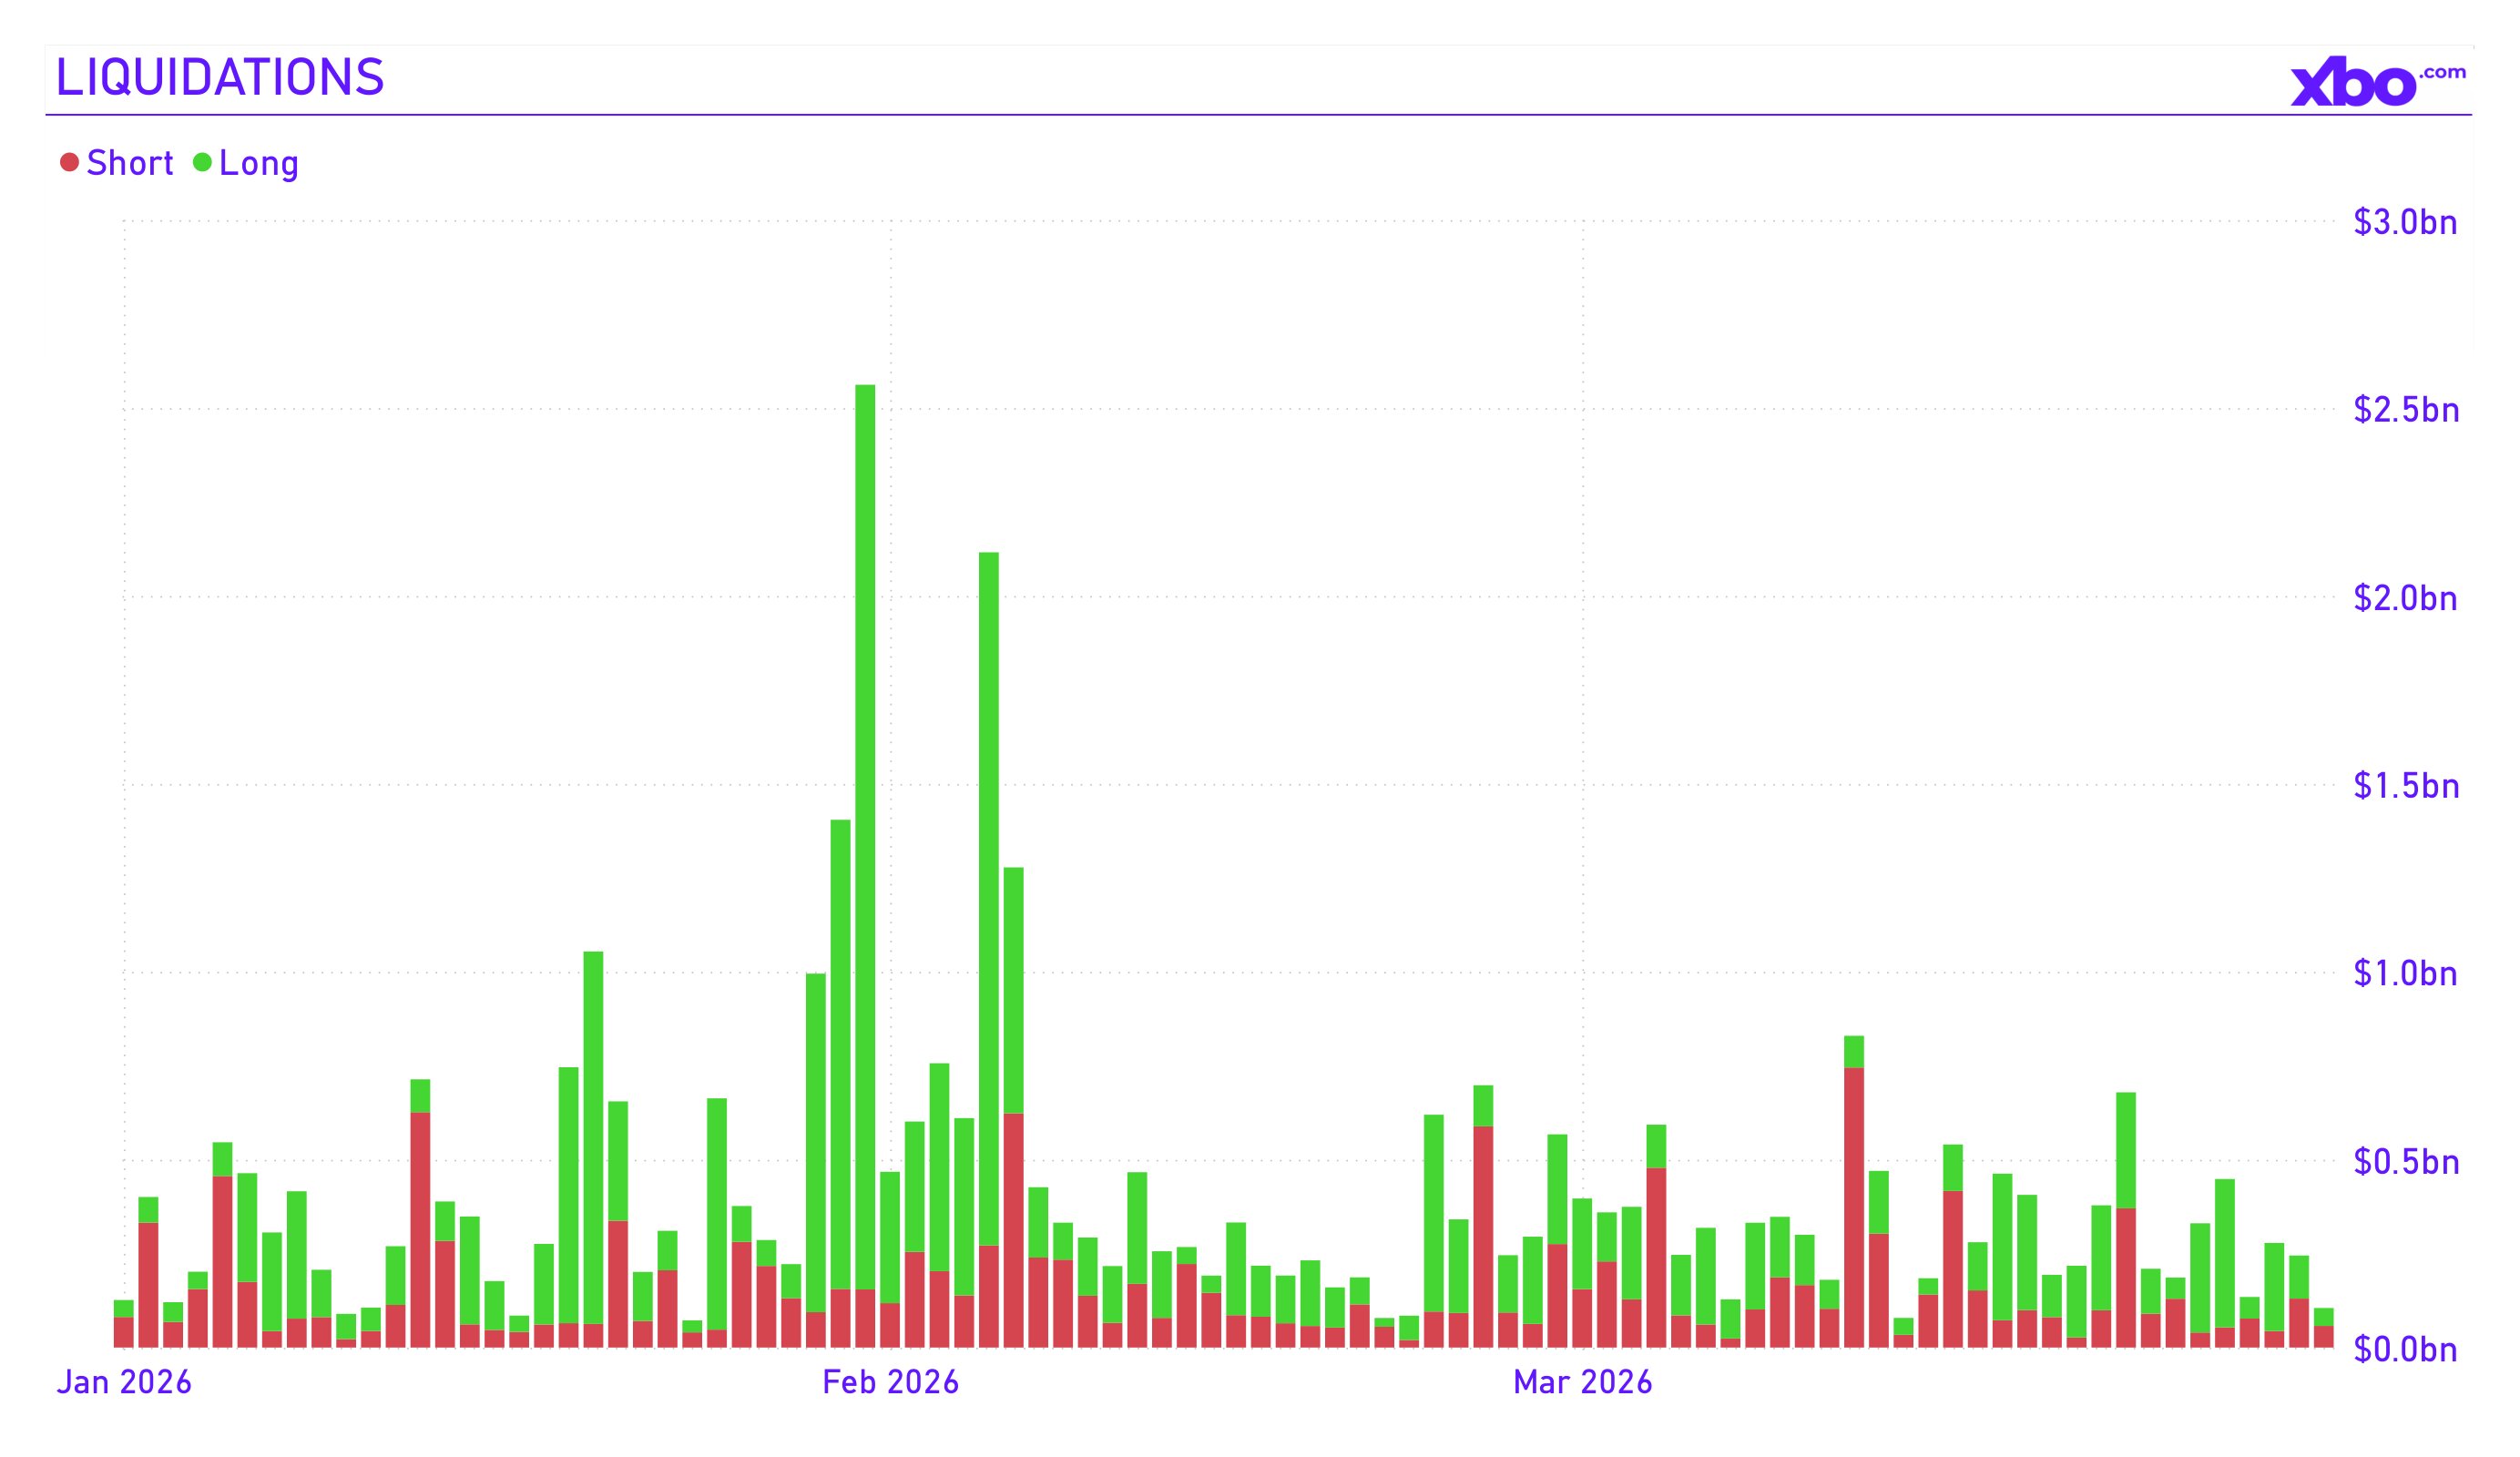
The main event of February (and arguably the entire quarter) was the outbreak of hostilities in the Middle East. On February 28, the United States and Israel launched a joint military operation against Iran. Traditional exchanges were closed for the weekend, and cryptocurrency became the only liquid market for investor reaction. Bitcoin plummeted from $74,000 to the $63,000–$66,000 zone within days. The closure of the Strait of Hormuz drove oil prices above $85 per barrel, and the Fear & Greed Index collapsed to a record low of 5, below the levels seen during the Terra crash and the FTX collapse. Total liquidations on the crypto market over a single weekend amounted to approximately $19 billion. By the end of February, BTC had lost 15% for the month, mirroring the February 2025 scenario, when the decline exceeded 17%.
3) March: Stabilization amid fear
March brought the first signs of a bottom: long-term holders sharply reduced selling, on-chain data showed a recovery in spot inflows, and BTC managed to return above $70,000 amid hopes for a diplomatic resolution to the Iran conflict. However, on March 18, following the FOMC meeting and Iran's attack on an LNG facility in Qatar, Bitcoin dropped 5% in a single day. By the end of the quarter, the market was trading at $68,200, showing neither a convincing bounce nor a new breakdown.
Source: tradingview.com
Market cap and dominance
Total crypto market capitalization declined by 21%, from approximately $2.93 trillion on January 1 to $2.32 trillion by the end of March. Meanwhile, Bitcoin dominance decreased from 59% to 58%. The modest scale of that drop is explained by BTC losing capitalization more slowly than altcoins, a dynamic further amplified by the outsized collapse of major alts.
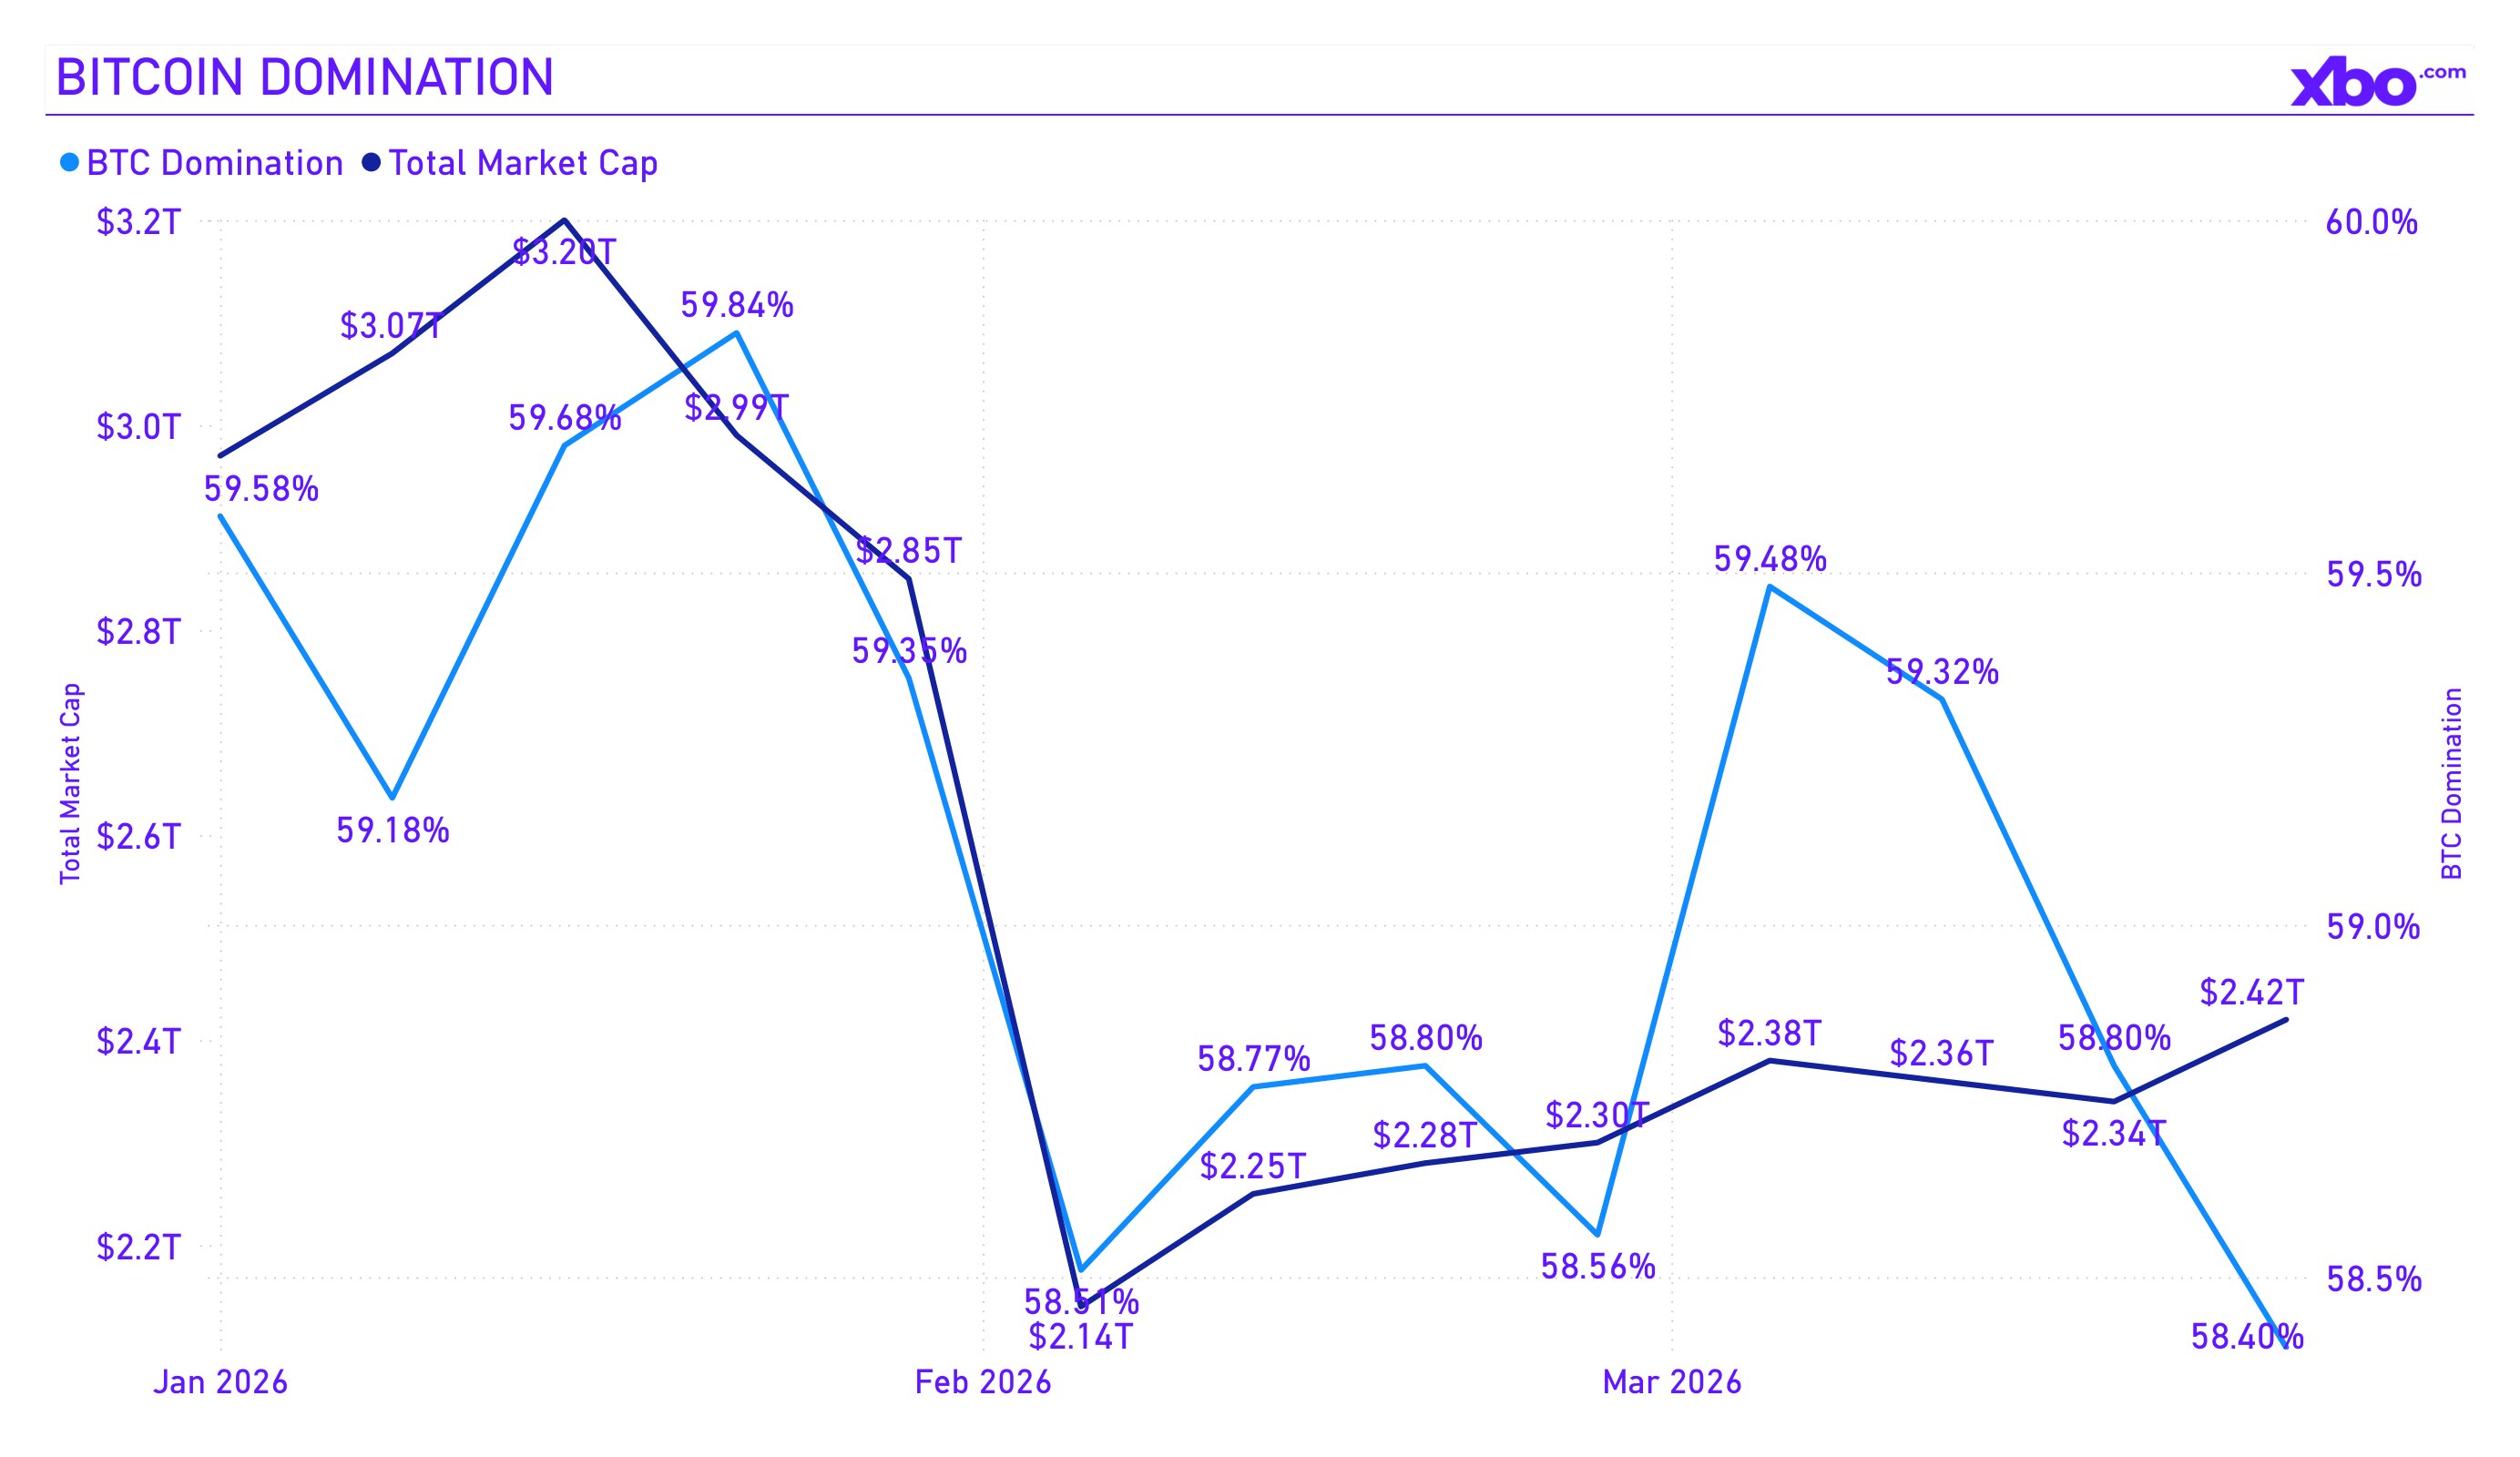
Source: coinmarketcap.com
Sentiment index: 46 Days of extreme fear
Perhaps the most accurate indicator of market conditions in Q1 2026 was the Crypto Fear & Greed Index. On February 6, the index dropped to an all-time low of 5. This was below the COVID crash of March 2020, the Terra collapse, and the FTX bankruptcy. By the end of March, the index had spent 46 consecutive days in the "extreme fear" zone, which became the longest unbroken streak since late 2022. At quarter's end, the index stood at 11 points, showing no sustained recovery.
There was, however, one key difference between this episode and previous ones. Whereas earlier extreme fear phases were triggered by single catastrophic events such as an exchange collapse or a stablecoin de-pegging, in Q1 2026 fear was fed by multi-layered pressure: war in the Middle East, an oil shock, inflation expectations, and rate uncertainty. This created a sense of "background anxiety" with no clear trigger for resolution.
At the same time, institutional and retail investor behavior diverged sharply: while Fear & Greed stood at single-digit levels, large whale wallets were accumulating BTC. Bitcoin reserves on exchanges dropped to 2.7 million BTC. This is the classic divergence between retail panic and institutional accumulation that has historically preceded major reversals.
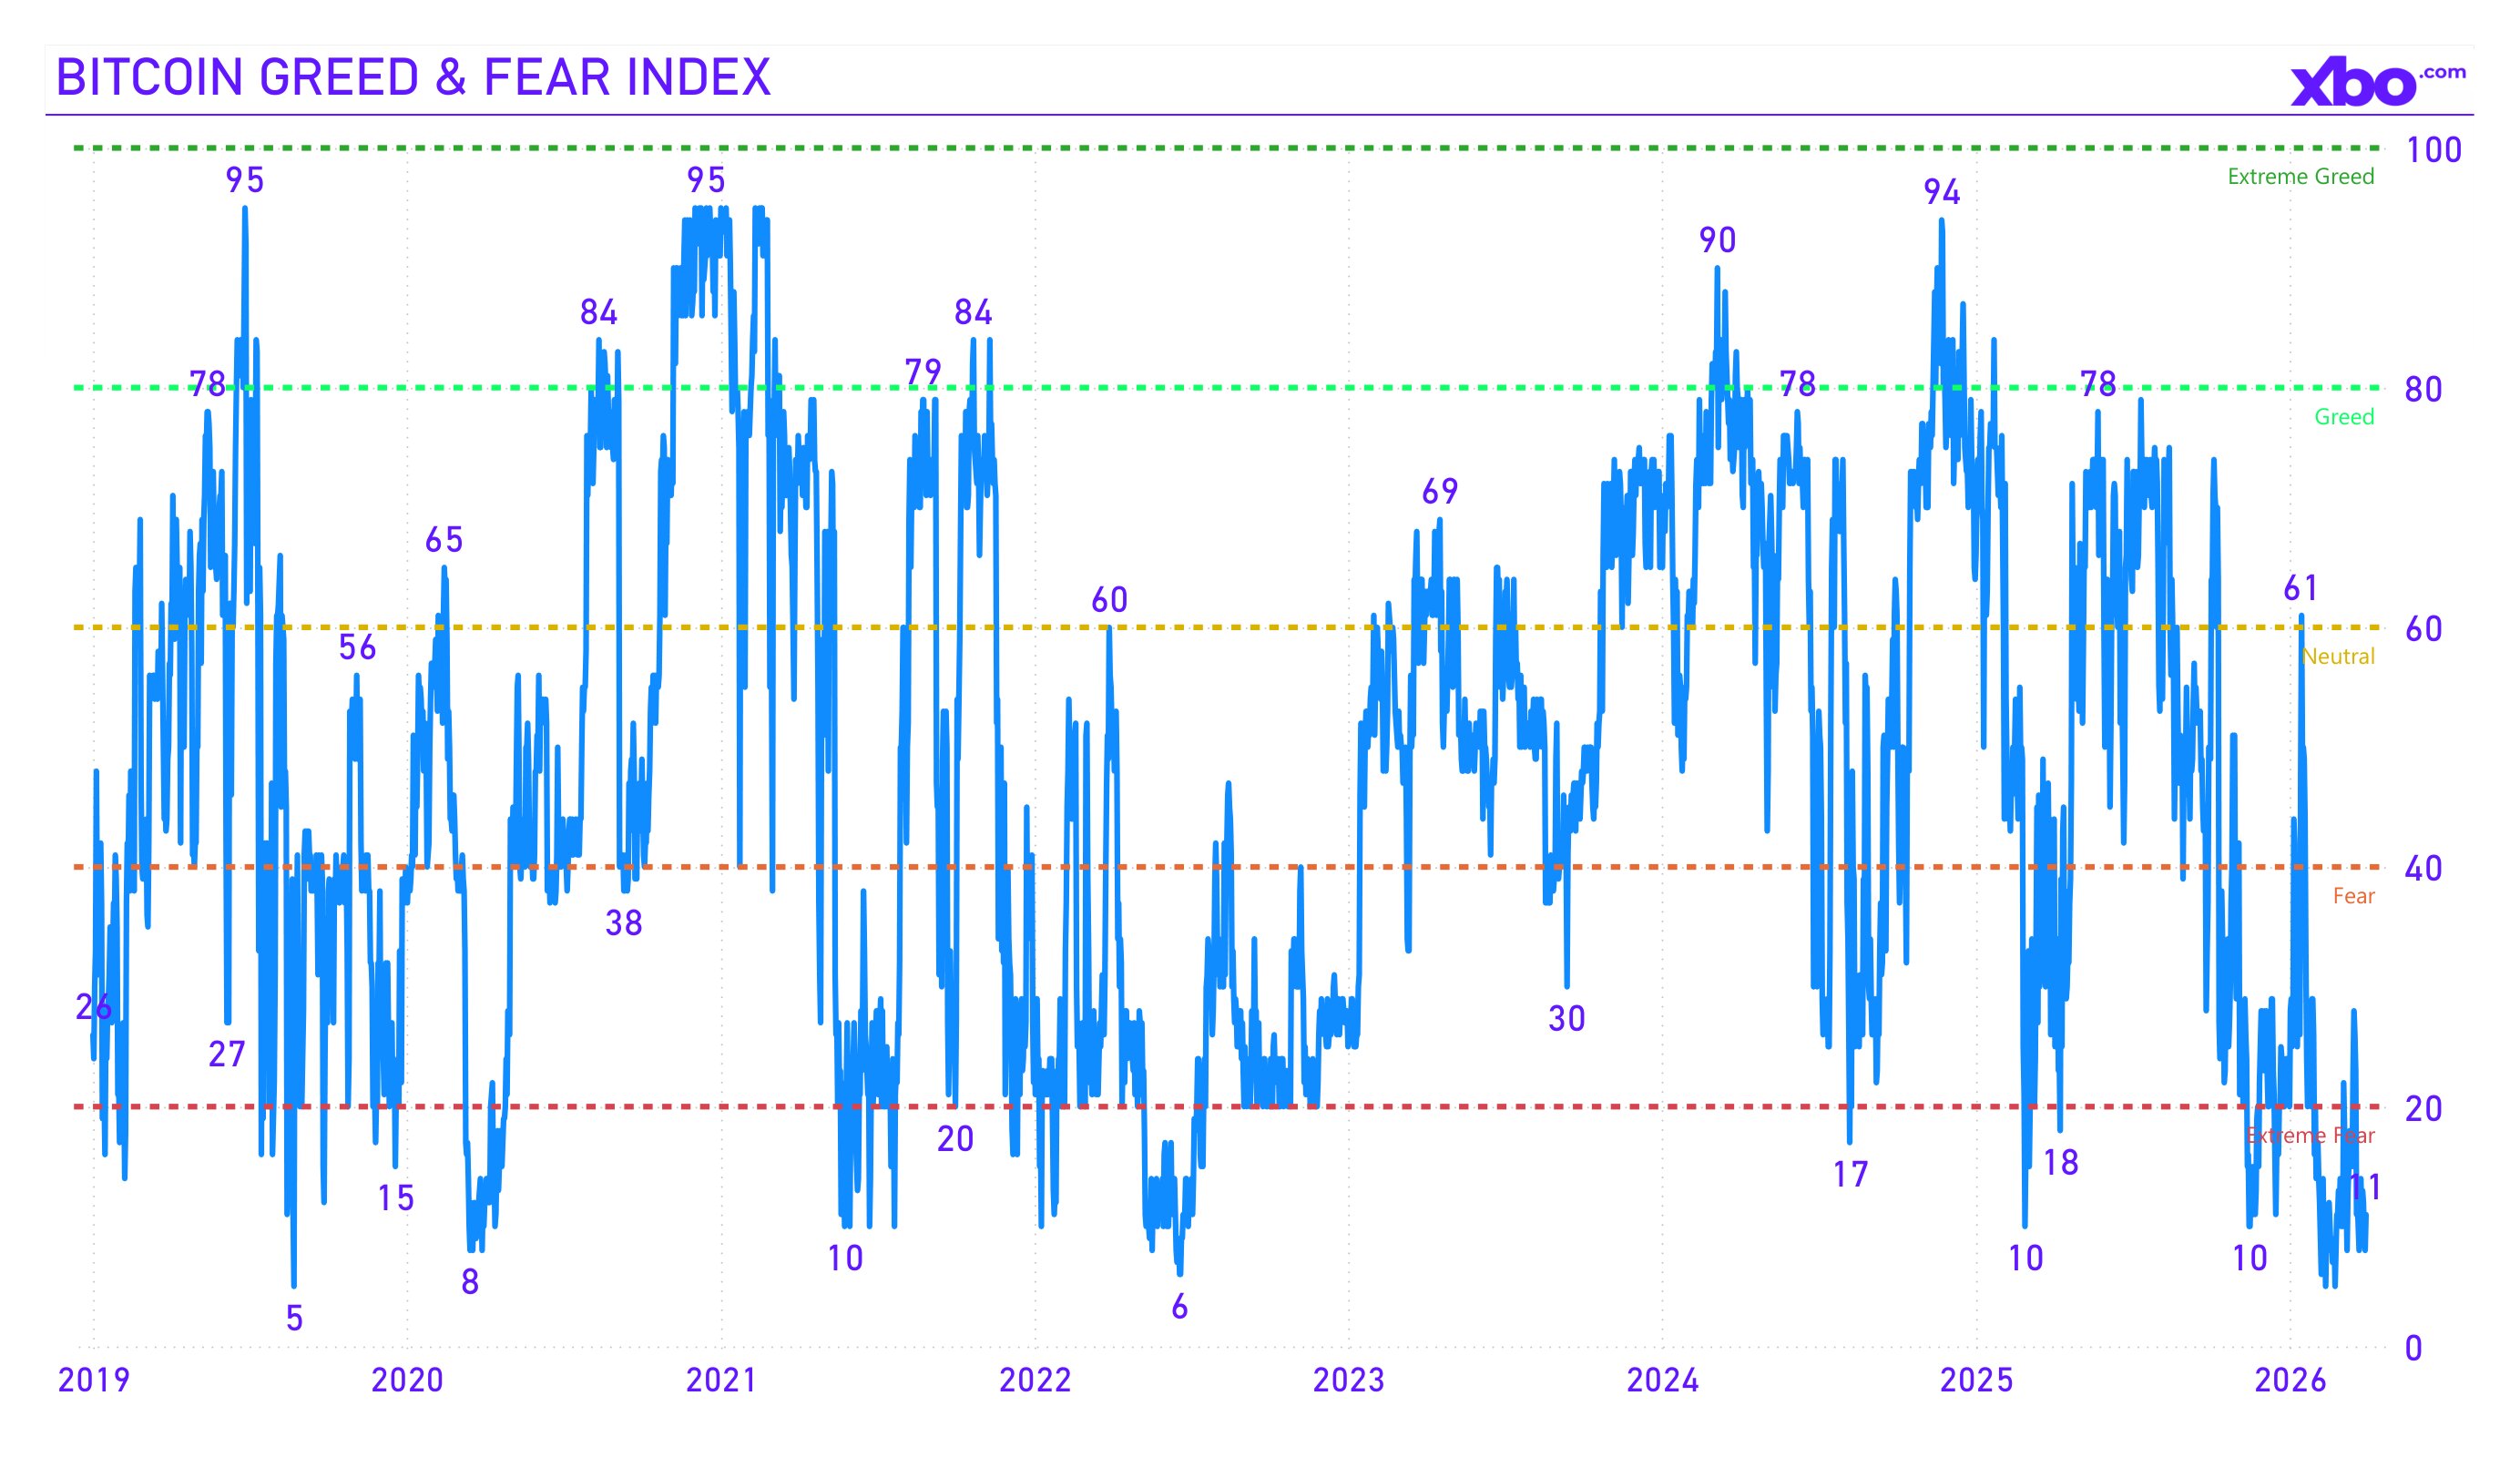
Source: alternative.me
Liquidations and leverage: Systemic deleveraging
The October 2025 liquidation event had already significantly reduced systemic leverage across crypto markets. By the start of Q1 2026, the systematic leverage ratio had dropped to approximately 3% of crypto market capitalization excluding stablecoins. However, the February events triggered a new wave of forced closures in late January.
Open interest on Bitcoin futures contracted significantly, and the funding rate structure indicated a deficit of speculative optimism. Paradoxically, this can be viewed as a healthy signal: a market cleared of excess leverage forms a more sustainable base for future recovery.
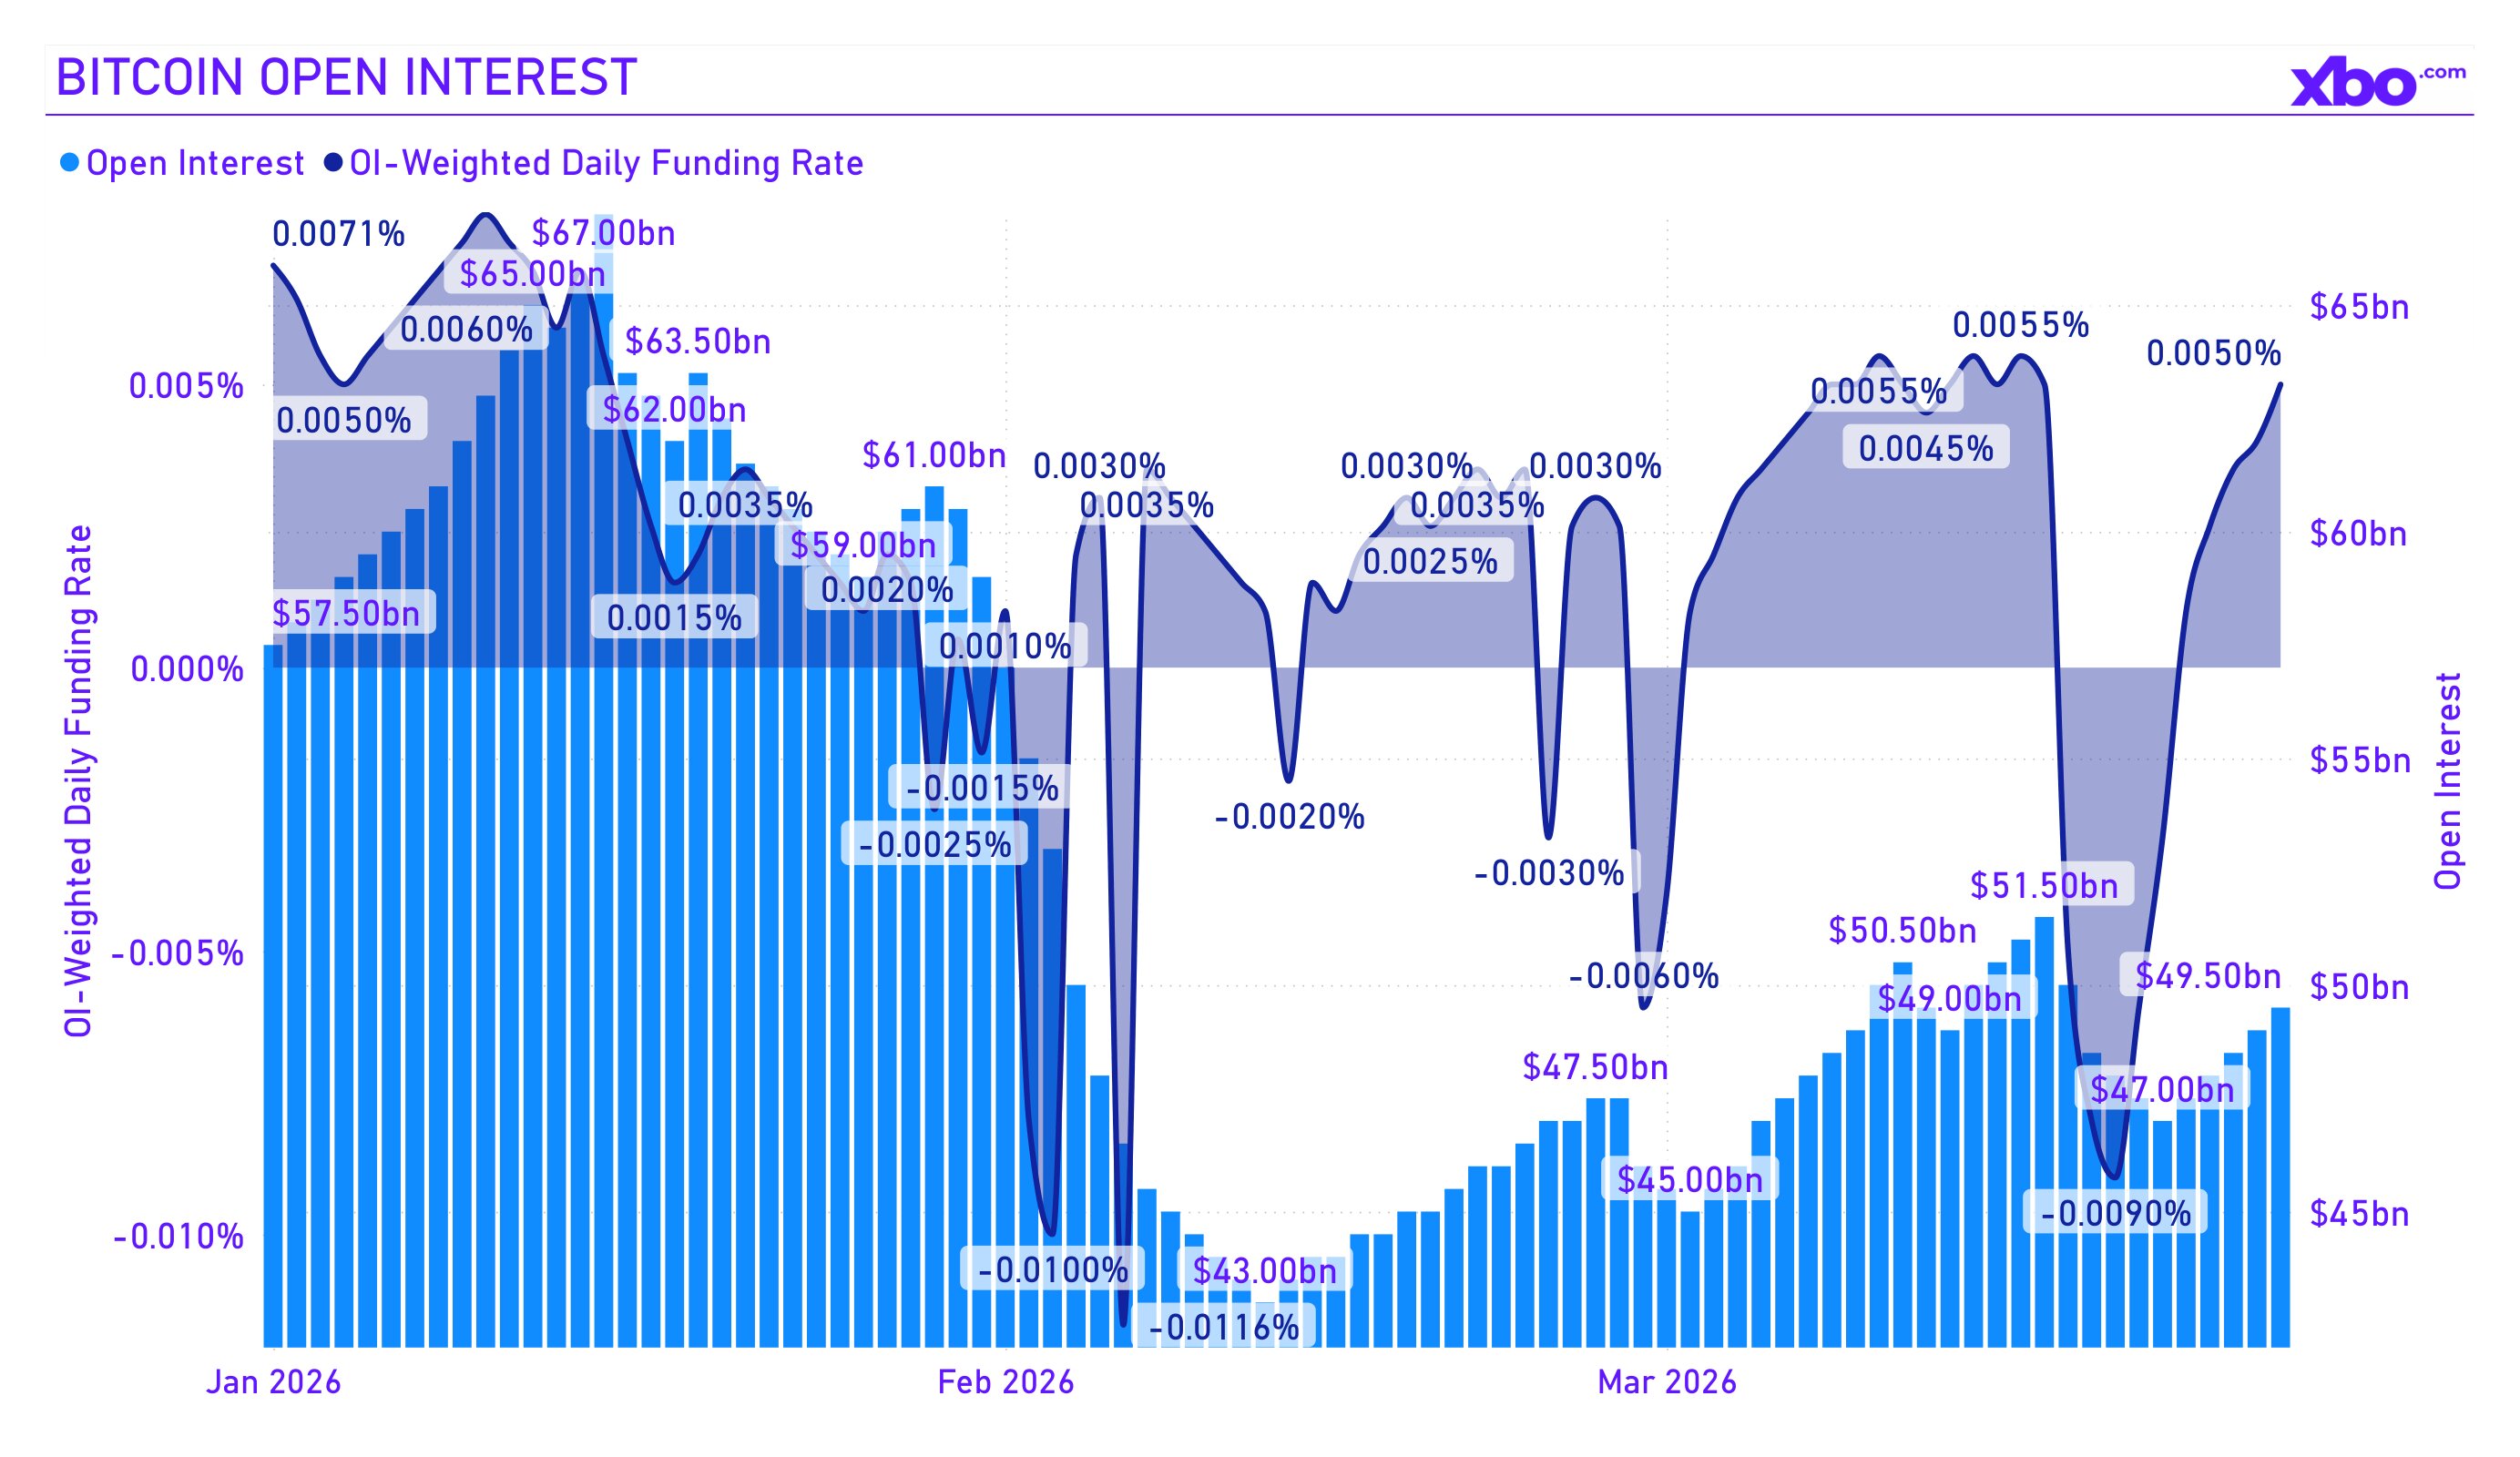
Source: Coinglass.com
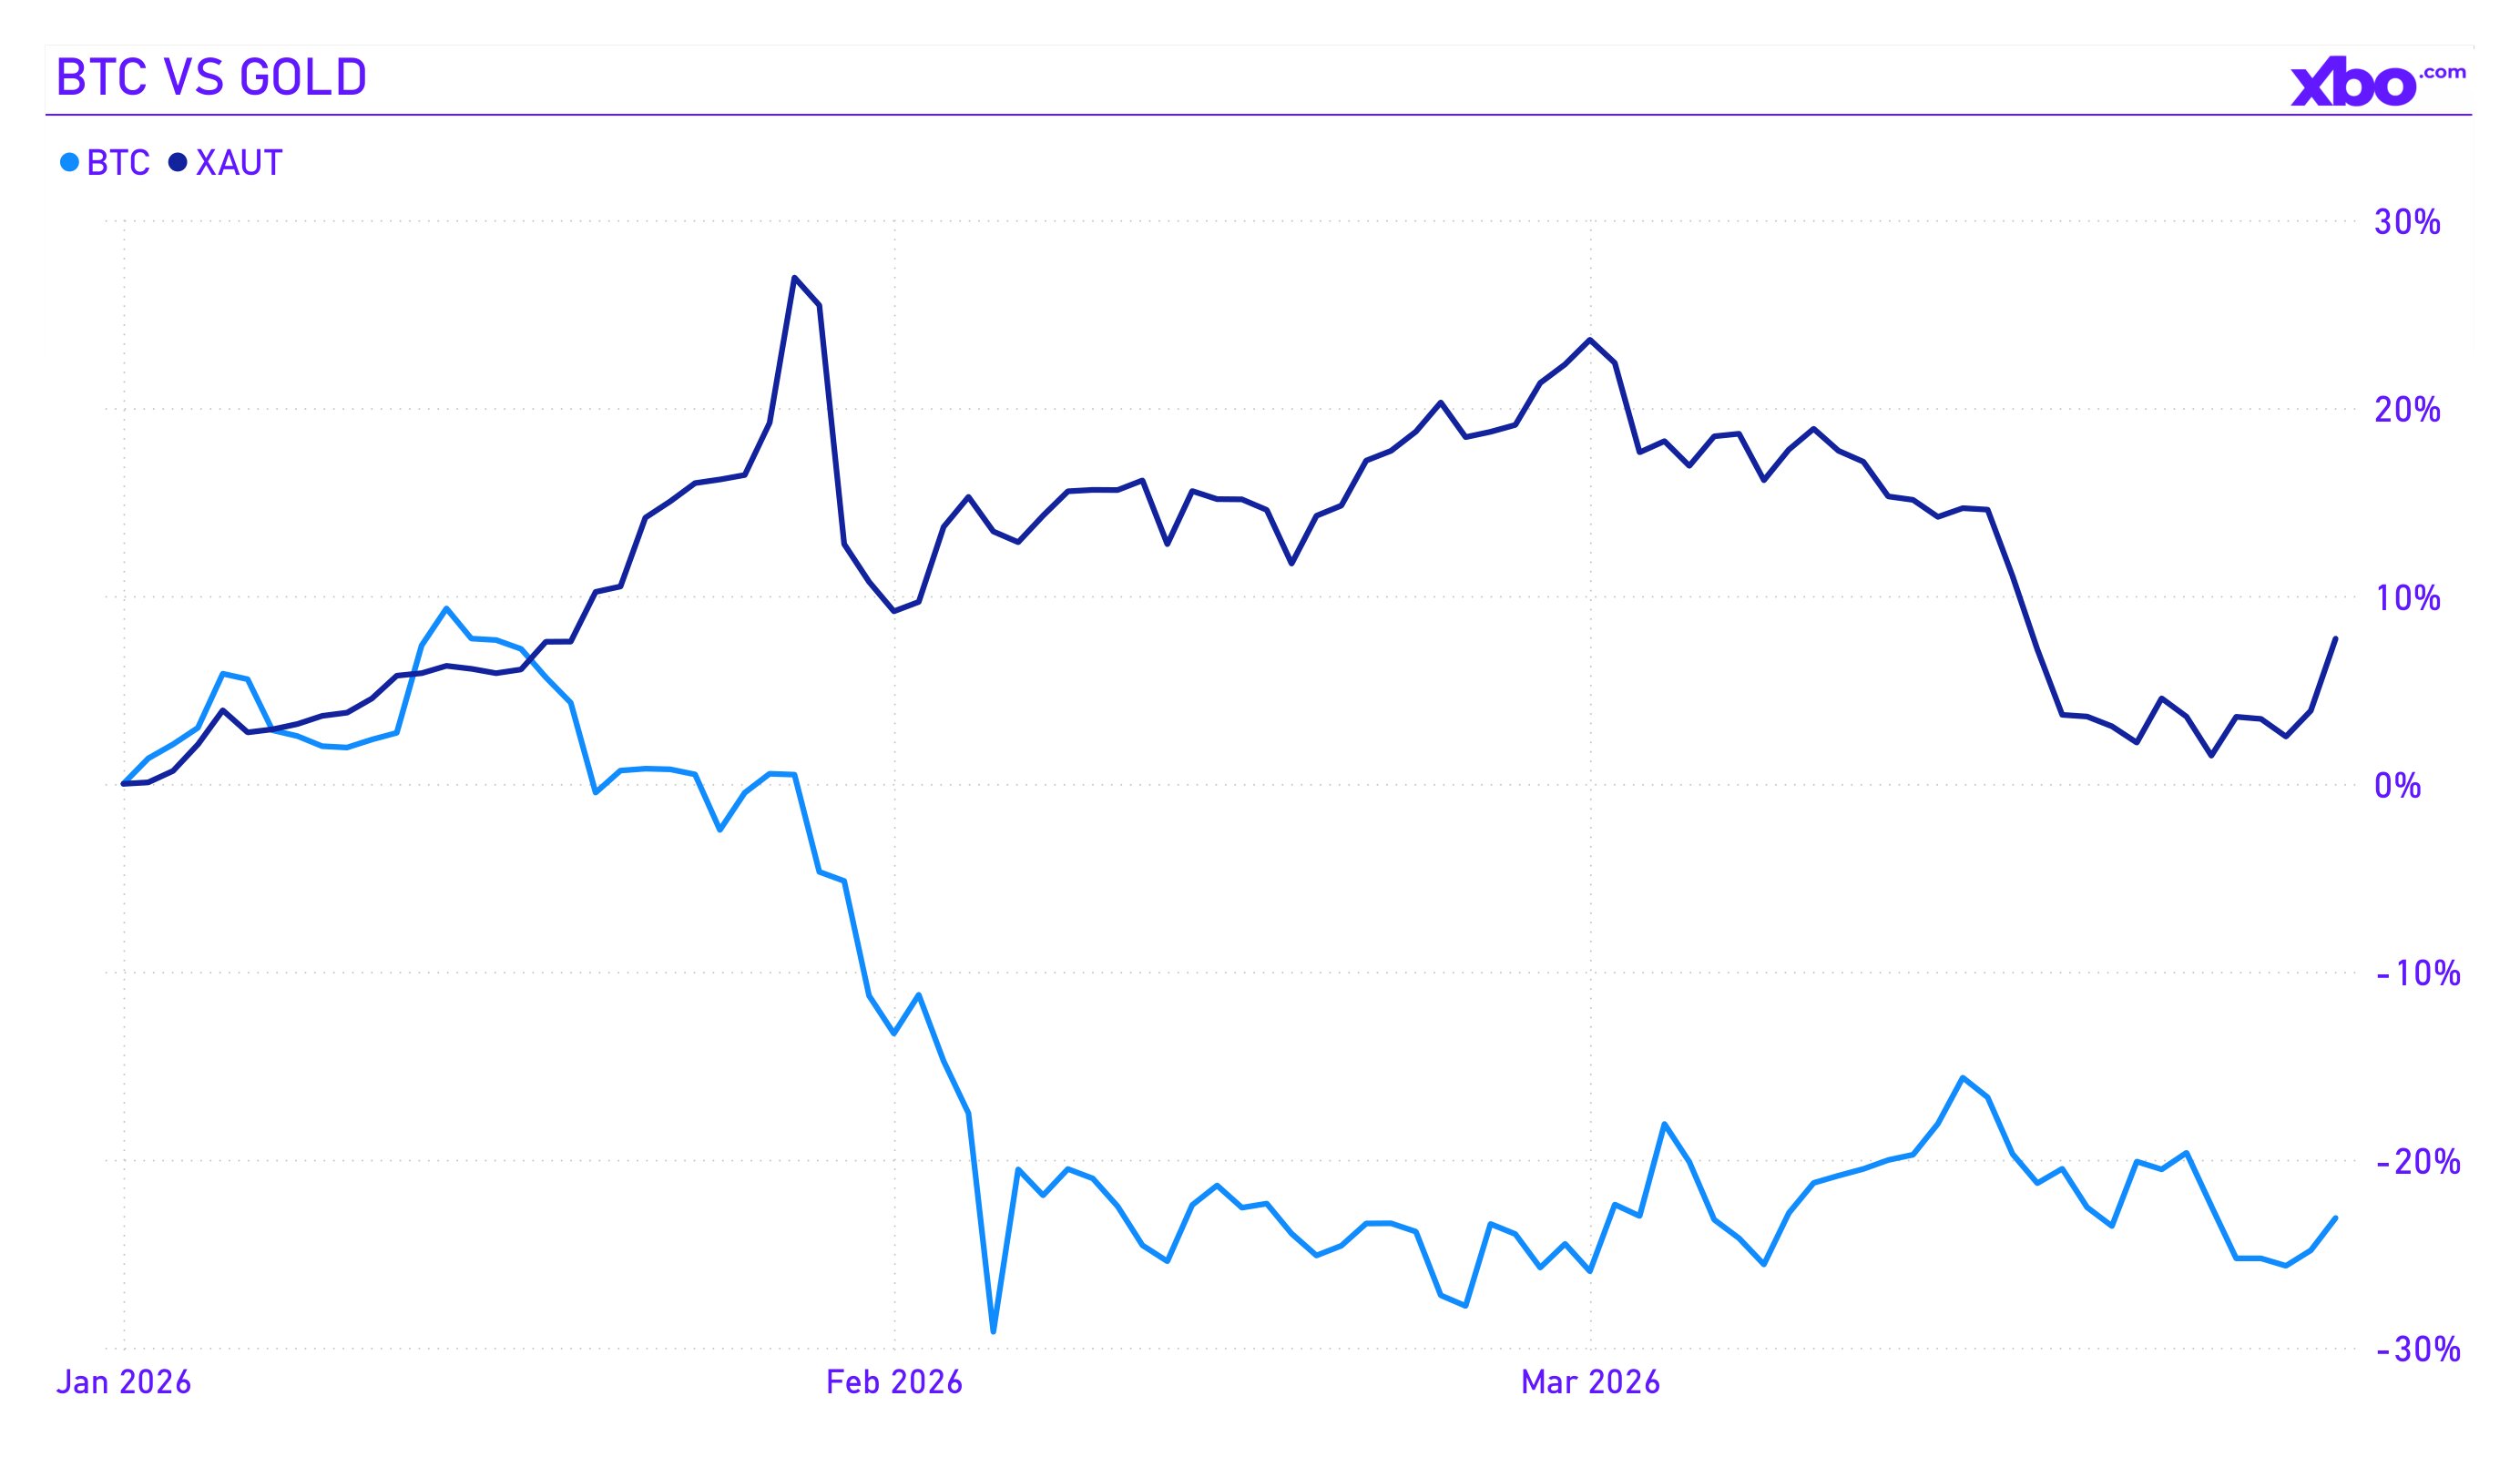
It is also worth noting that Bitcoin's value as a safe-haven asset remains in question, as its correlation with stock market indices is significantly higher than with gold.
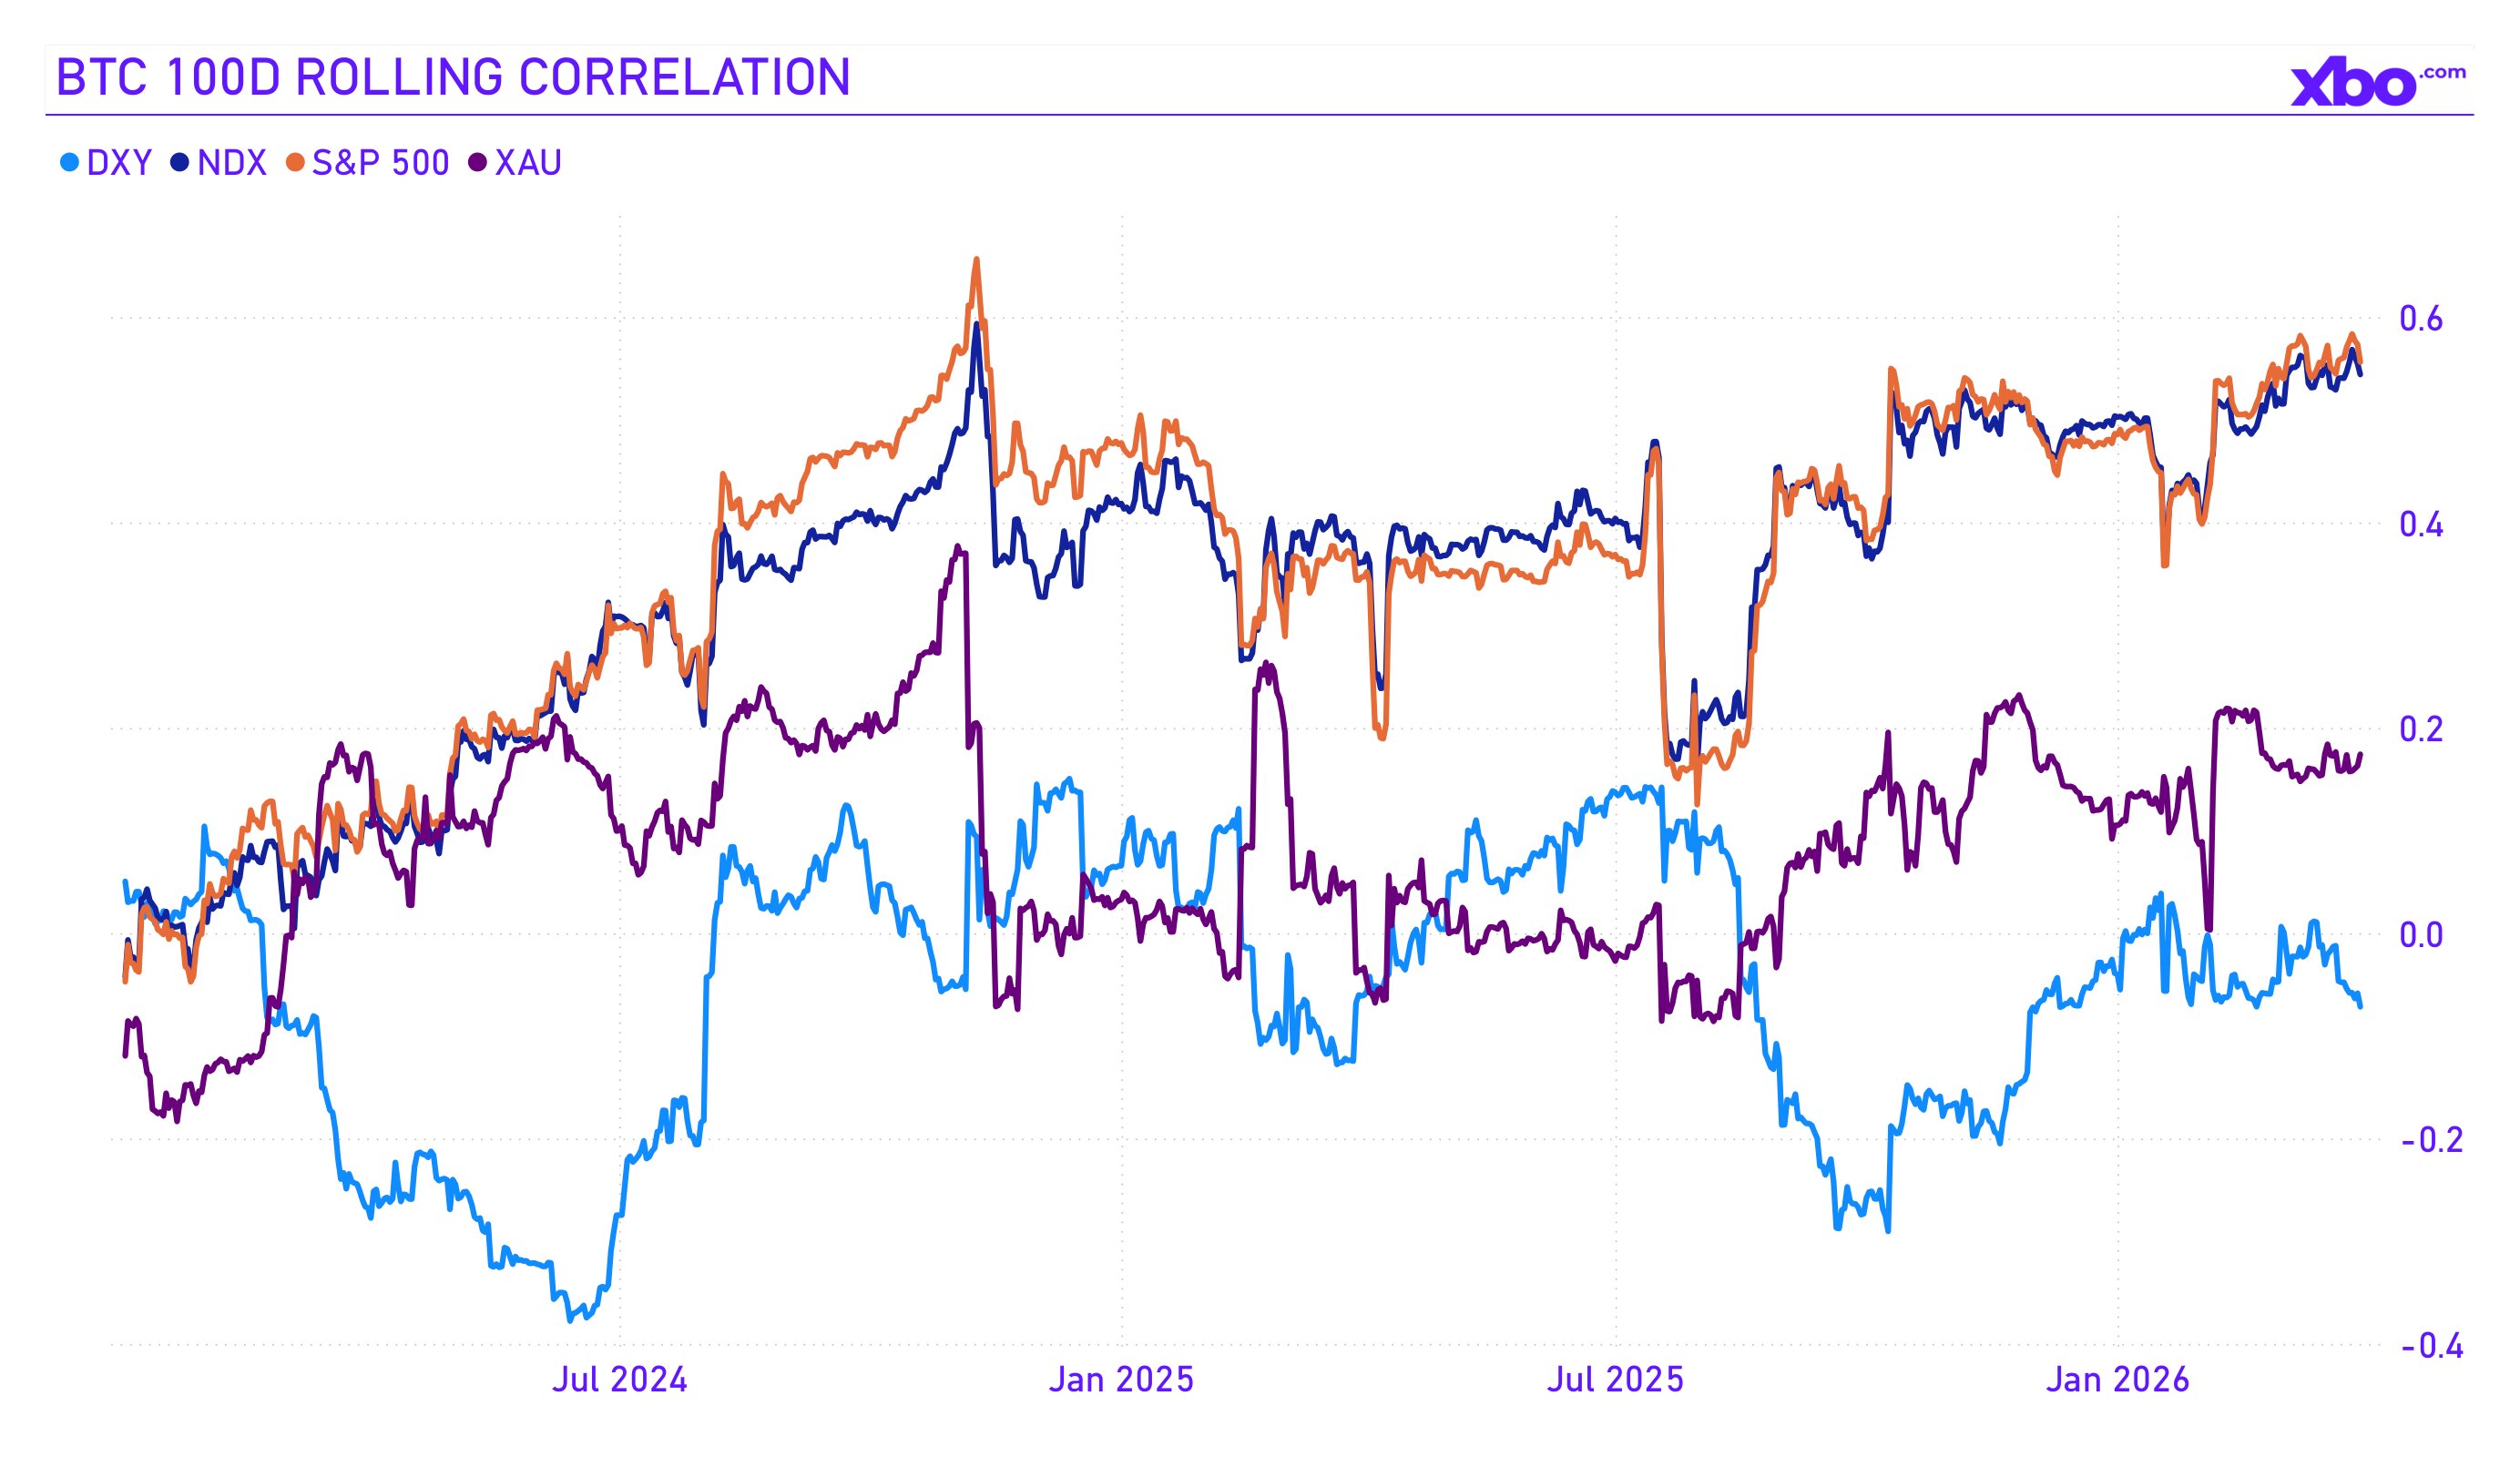
Source: nasdaq.com, investing.com
Interim summary
The first quarter of 2026 was a stress test for the crypto industry on multiple levels simultaneously. The market demonstrated its vulnerability to external macroeconomic and geopolitical shocks, confirmed its growing correlation with traditional risk assets, and failed to serve as a refuge during a crisis. Yet beneath the surface of panic, processes were forming that historically were associated with future reversals: whale accumulation, depletion of exchange reserves, leverage washout, and extremely low sentiment index readings.
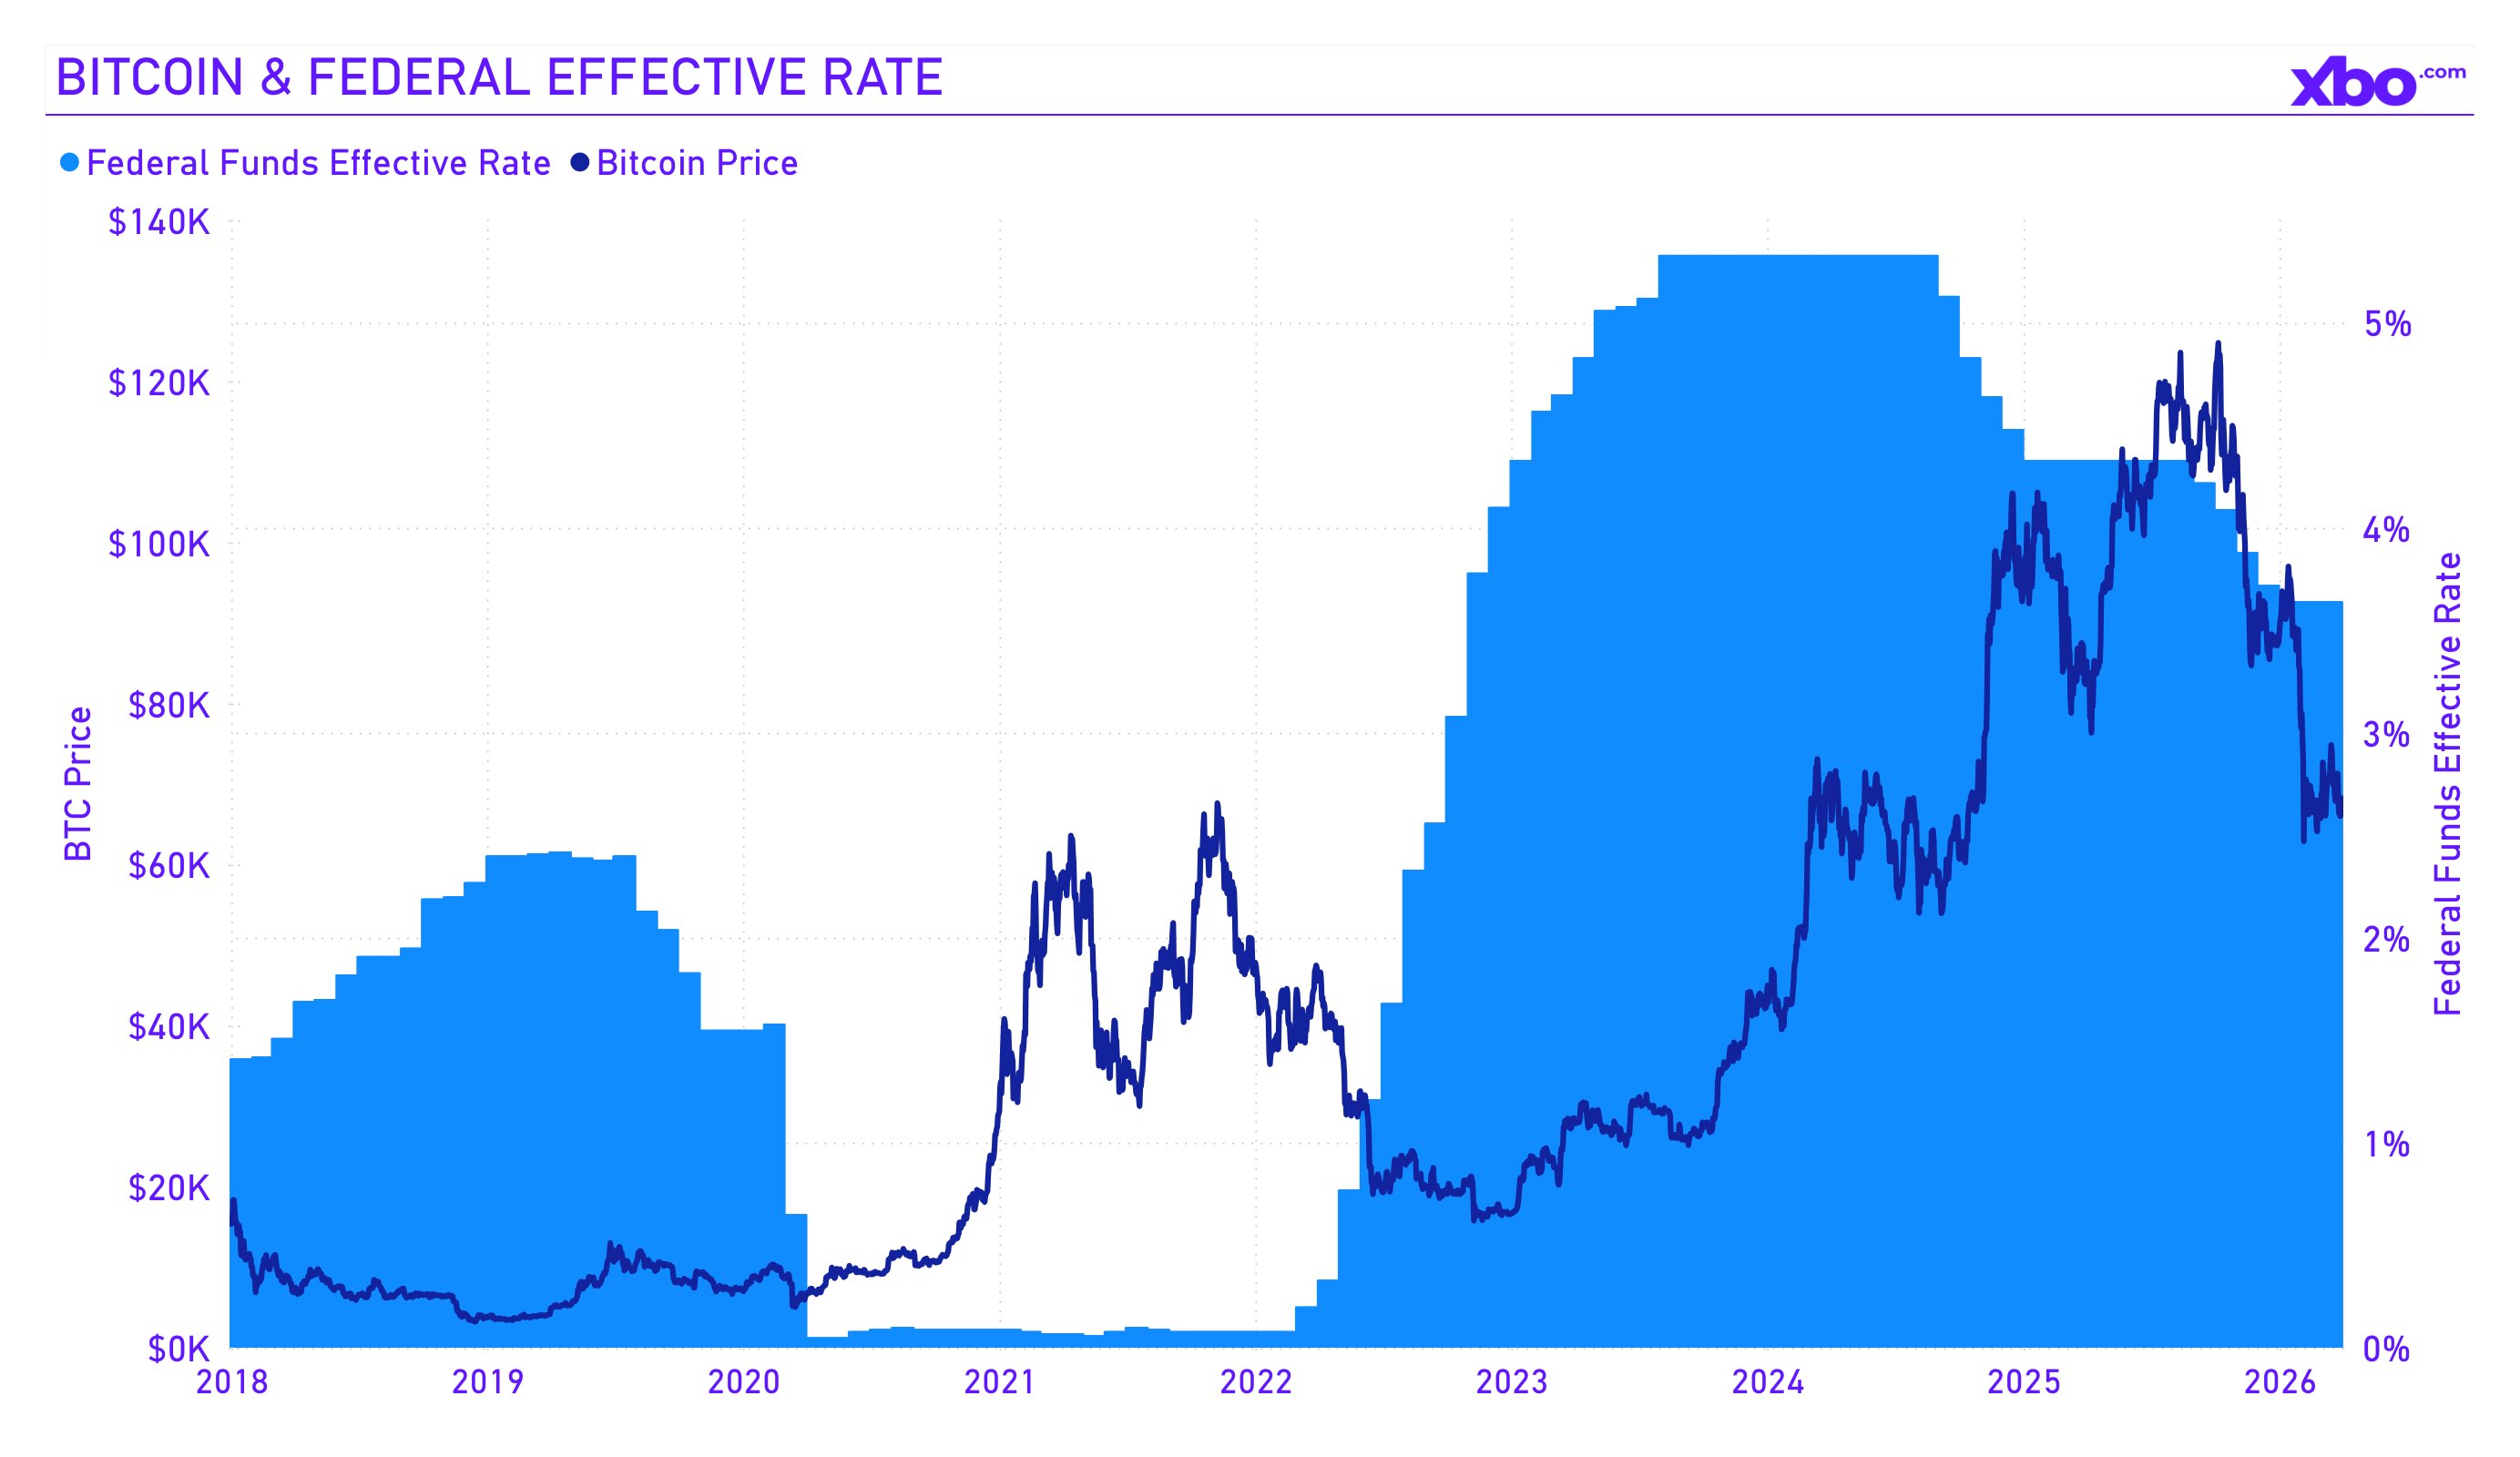
US Macroeconomics: The Fed Trapped, Inflation Returns
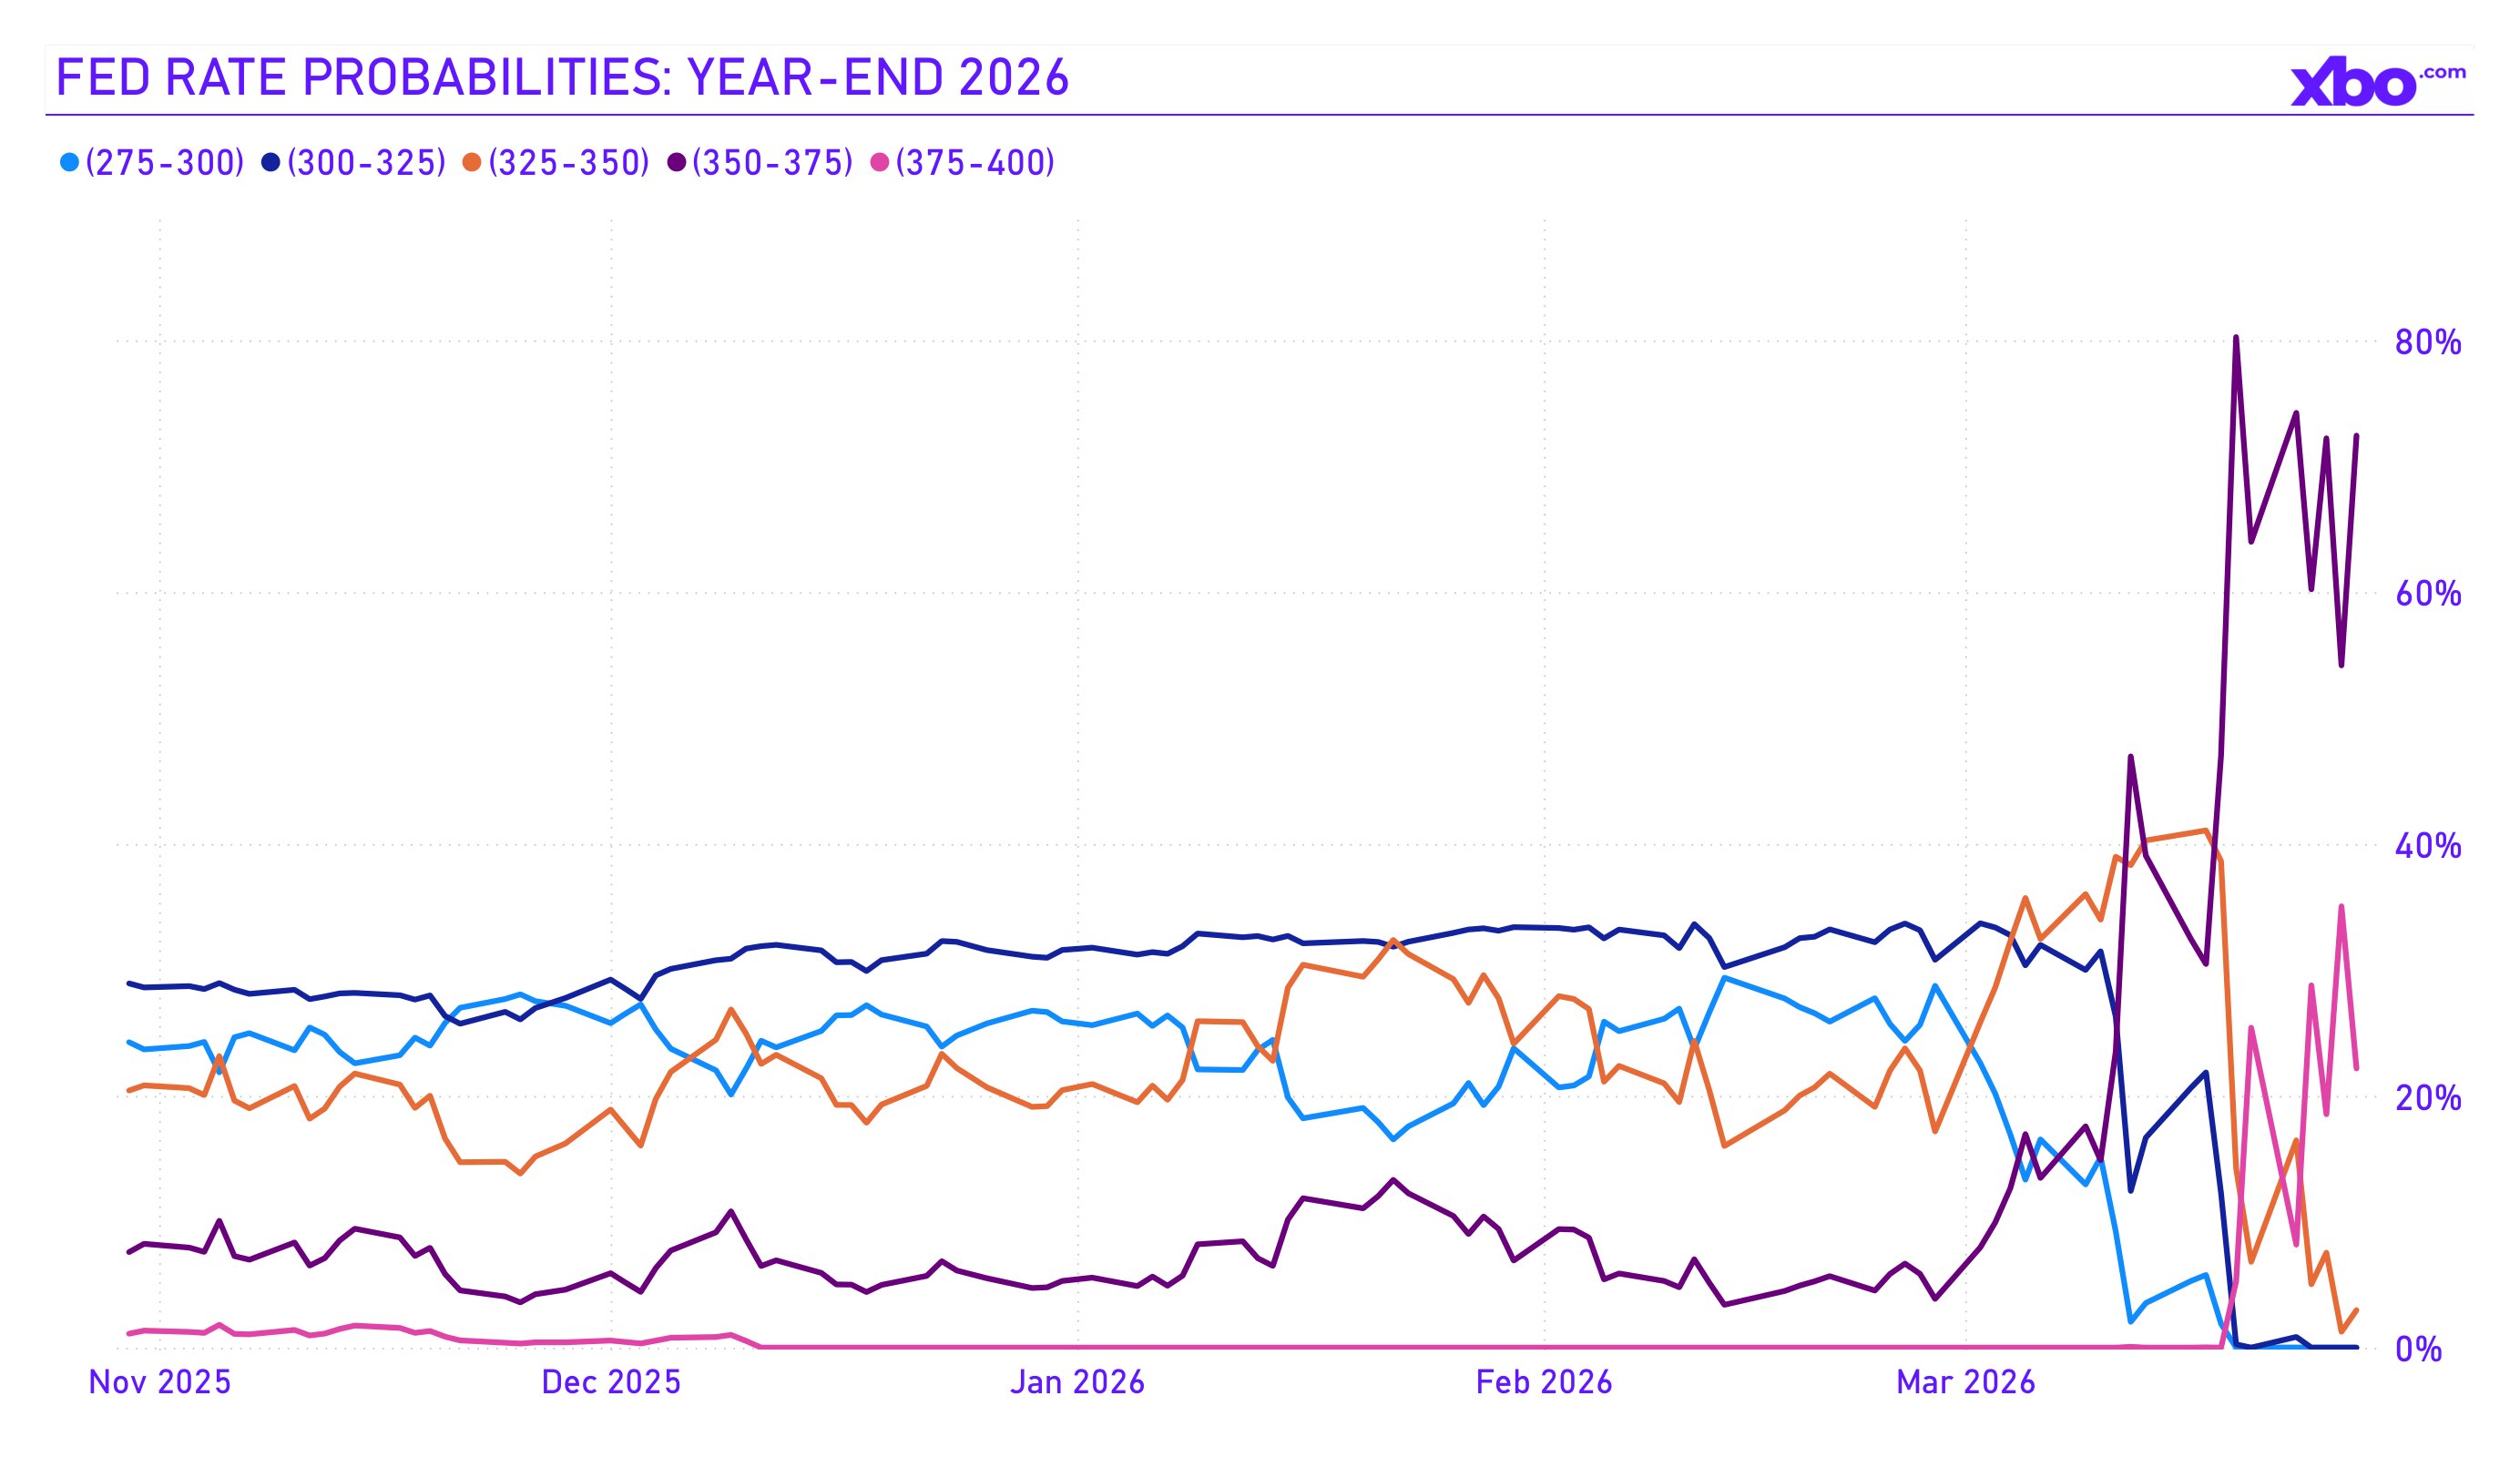
In 2025, the Fed cut rates three times (in September, November, and December), bringing the federal funds range from 4.75–5.00% to 3.50–3.75%. Markets entered 2026 expecting two more 25 bp cuts, priced into rate futures. Coinbase Institutional's January report reflected this consensus: analysts forecast cumulative easing of 50 bp in 2026, which was expected to provide a tailwind for risk assets.
Reality proved different. At the January meeting, the FOMC decided to leave rates unchanged. The statement's language was measured: economic activity is expanding at a "solid pace," job gains "remain low," inflation is "somewhat elevated." This alone was not a shock, since the market expected a pause. However, the tone of the minutes proved significantly more hawkish: an "overwhelming majority" of participants noted that risks of persistently high inflation remain, and some even acknowledged the possibility of rate hikes if inflation does not continue to decline. This was the first warning.
At the March meeting, the Fed again left rates intact. But the context had changed radically: between the two meetings, the war with Iran had begun, oil had surged above $100 per barrel, and February PPI data had rattled the market. At the March 18 press conference, Powell repeatedly emphasized that it was "too early to assess" how the war would affect inflation and employment, effectively acknowledging that the Fed was operating under conditions of abnormal uncertainty.
By quarter's end, market expectations had shifted, with the next rate cut expected no earlier than September.
Source: cmegroup.com
Inflation: The calm before the storm
Formally, inflation data for the first quarter looked stable. Annual CPI in January slowed to 2.4%, the lowest reading since May 2025, down from 2.7% in November–December. The February report confirmed this trajectory: CPI held at 2.4% y/y, core CPI at 2.5%, both matching the consensus forecast. On the surface, this painted a picture of controlled disinflation approaching the Fed's 2% target.
However, beneath the surface, alarming signals were building. Core services inflation (so-called "supercore" inflation, which the Fed pays particular attention to) remained elevated. Food prices were rising at 3.1% y/y, beef was up 15% over the year, coffee up 18%. Tariff effects, while not triggering a sharp spike in goods prices, continued to seep through wholesale markups: January PPI rose 0.5% m/m, and February PPI came in at 0.7% m/m, more than double the 0.3% forecast.
But the main inflation threat came from outside economic models. The war with Iran, which began on February 28, sent oil prices soaring from $70 per barrel to a Brent peak above $119 in the first days of March. By the time the February CPI was published, oil was trading around $100, roughly 70% above the start-of-year level. This oil shock had not yet been reflected in February data, but economists immediately revised their forecasts. According to Capital Economics estimates, a sustained oil price of $100 per barrel would push CPI to 3.5% by the end of 2026. RBC Economics warned: if WTI holds above $75, headline inflation will exceed 3% as early as Q2; at $100 it will remain above 3% for the entire year. As Sonu Varghese from the Carson Group said about the February CPI, "This is the calm before the storm that will show up in March due to surging gasoline prices."
The Fed revised its own forecasts: in the March dot plot, the PCE inflation forecast for 2026 was raised to 2.7% from 2.4% in December, and core PCE was also raised to 2.7% from 2.5%. This meant that even by the Fed's own projections, inflation would not reach the 2% target this year (and this was before the full impact of the oil shock showed up in the data).
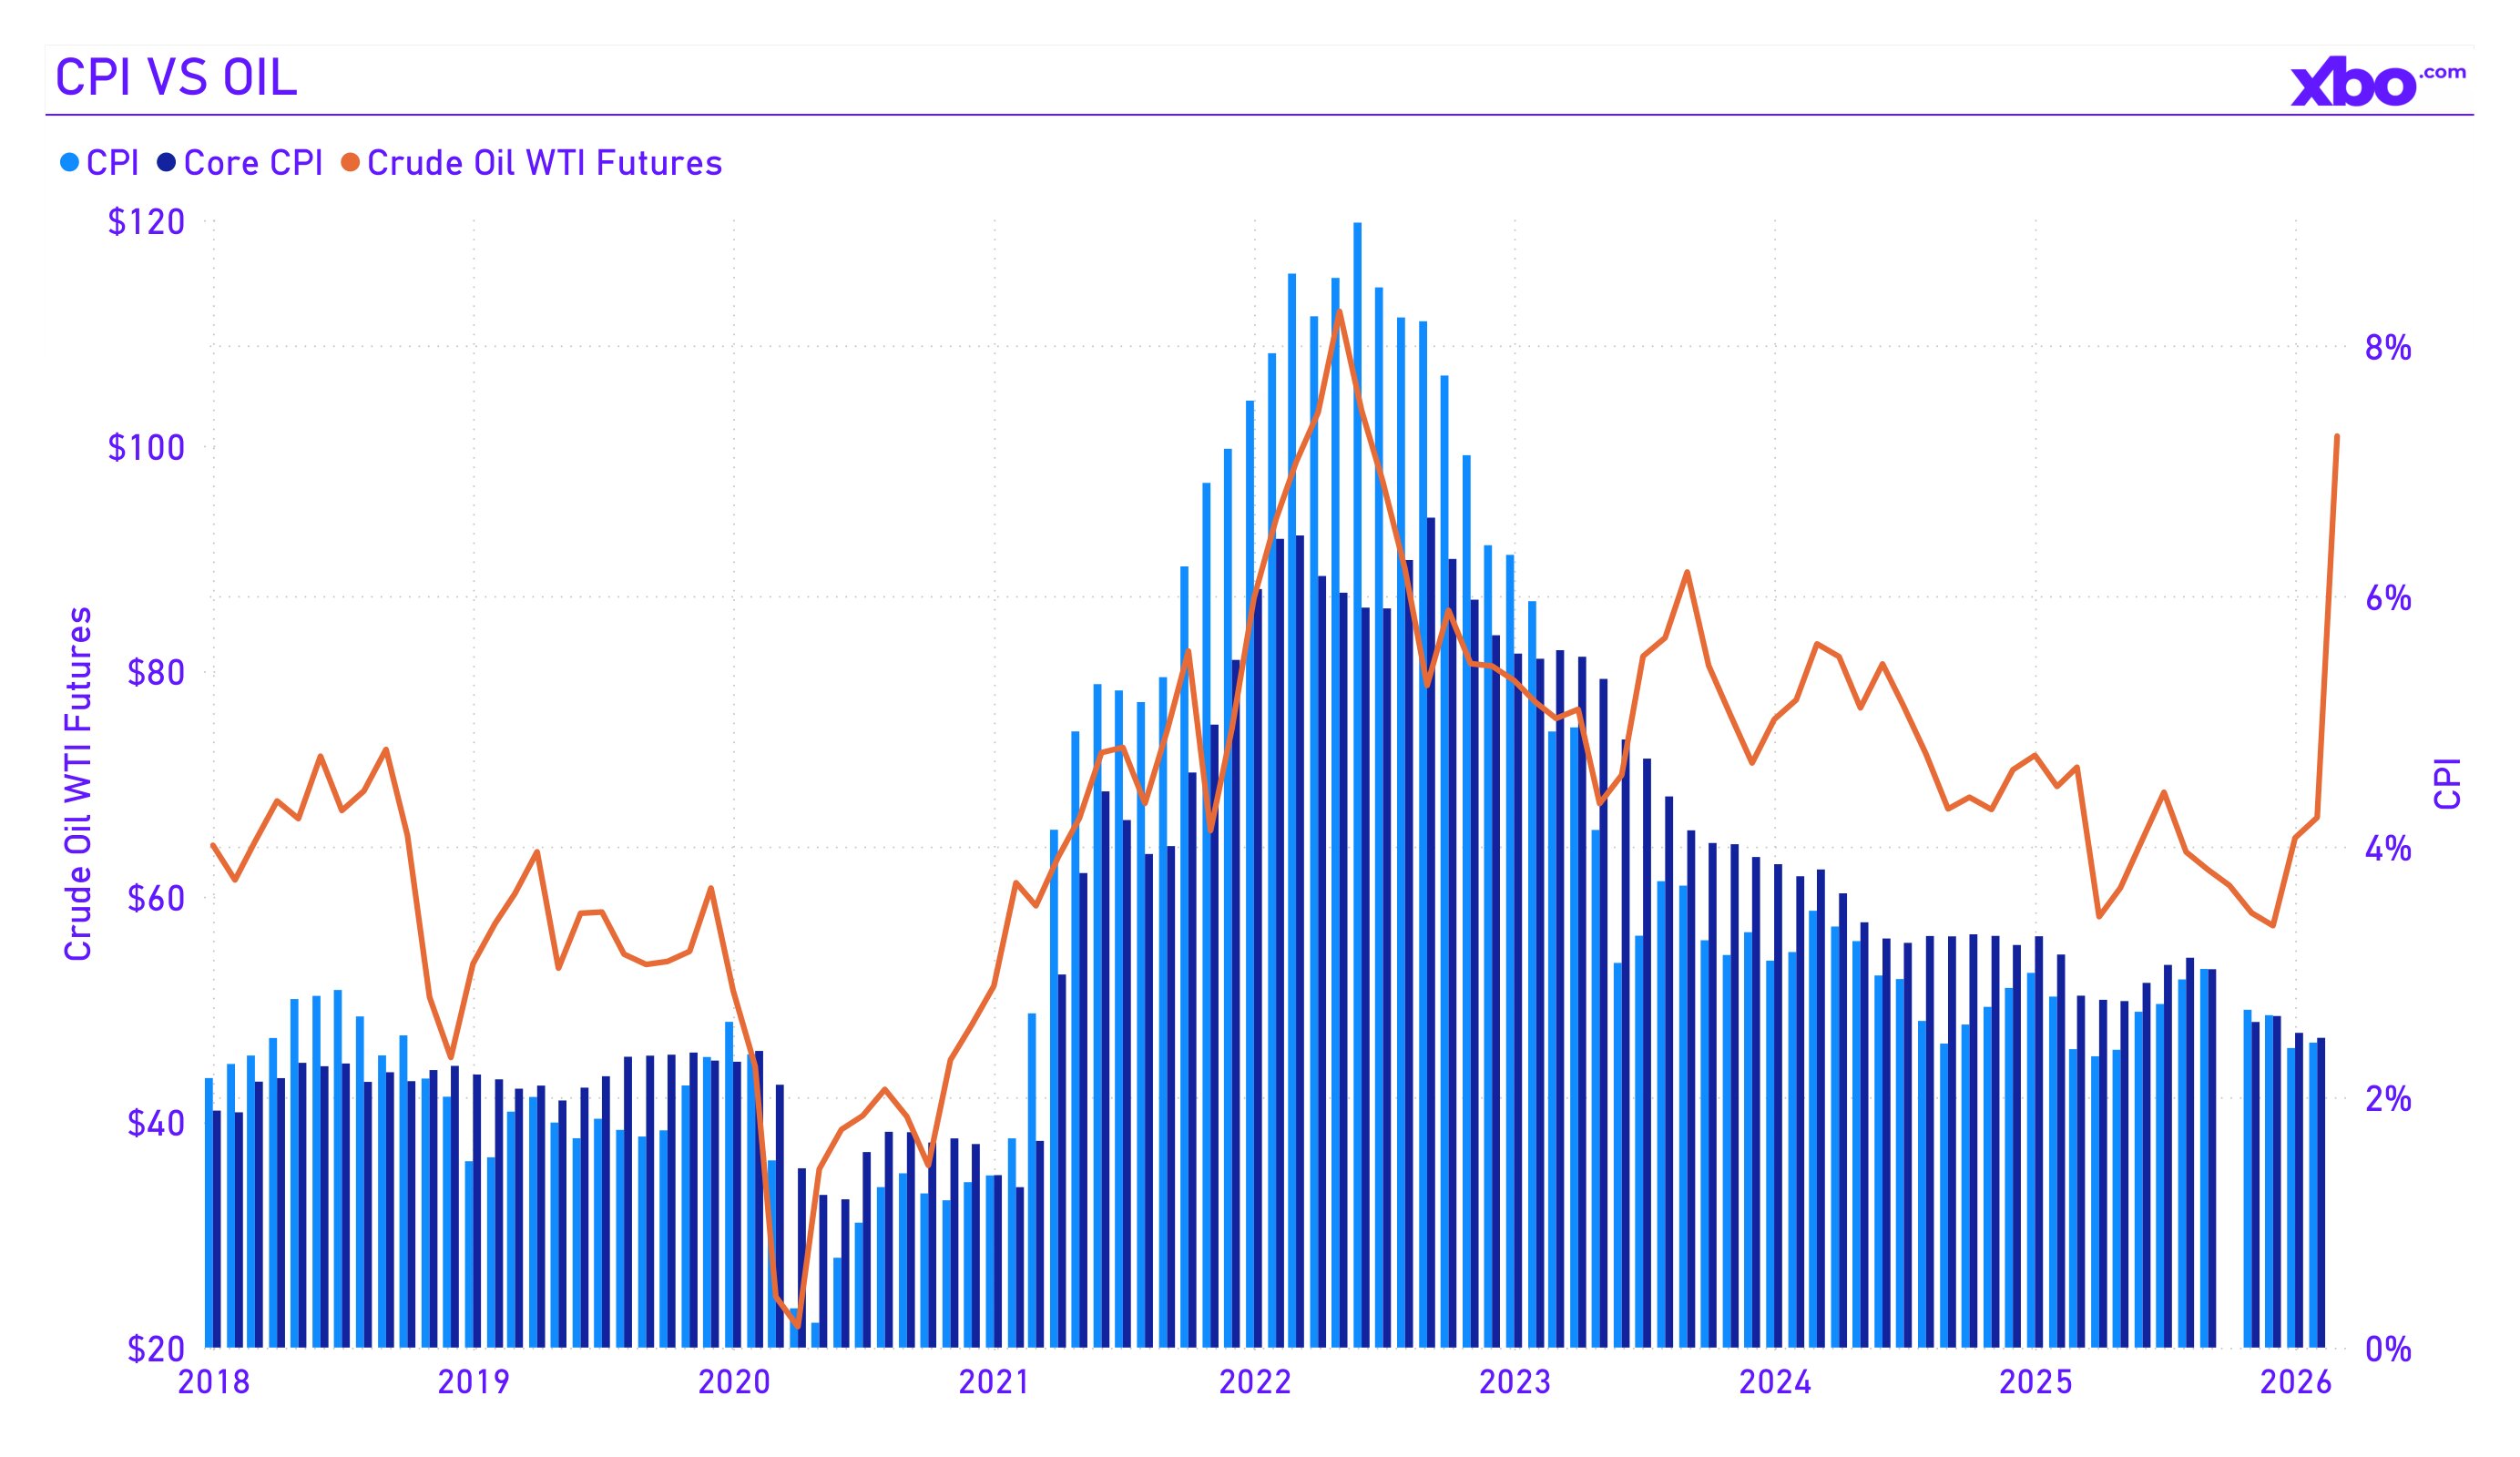
Source: bls.gov, fred.stlouisfed.org, investing.com
Labor market: Slow cooling
The third element of the Q1 2026 macro puzzle was the labor market, which was gradually losing strength, creating the risk that the Fed would face a stagflation dilemma. In 2025, the US economy created 584,000 new jobs, which was a sharp deceleration from 2 million in 2024. Some economists attributed part of this slowdown to rising automation and AI adoption, but other factors may also have been at play: the labor market was cooling.
The February Nonfarm Payrolls report, published on March 7, recorded an unexpected drop in new job creation. Meanwhile, the unemployment rate remained relatively stable at about 4.4%, which was consistent with the Fed's December forecast. However, qualitative indicators were deteriorating: hiring pace was slowing, and JOLTS job openings continued the decline that began in the second half of 2025.
For the Fed, this meant a stalemate. On one hand, the labor market slowdown called for policy easing, as a rate cut was needed to support employment. On the other, inflation fueled by tariffs, persistent services prices, and the looming oil shock would not allow it. Powell candidly acknowledged this contradiction, stating that the Fed's two mandate goals of low inflation and a healthy labor market had found themselves "in tension with one another."
For cryptocurrencies, this macro context was unambiguously negative. The "higher for longer" rate regime meant a higher opportunity cost of holding crypto assets compared to risk-free instruments, less free liquidity in the system, and increased attractiveness of fixed income. With high-yield savings accounts offering up to 5% annually and short-term Treasuries providing comparable returns at zero risk, incentives for allocating capital to volatile crypto assets were minimal. Liquidity in the economy continued to contract, and the Fed gave no signals that it was ready to reopen the tap.
The Kevin Warsh factor
An additional source of macro uncertainty was the nomination of economist Kevin Warsh for the position of next Federal Reserve Chair. Warsh, a former Fed Governor, is known as an advocate of tighter monetary policy. His potential nomination was perceived by markets as a signal that the Trump administration, despite its rhetoric of supporting markets, was prepared for a more hawkish central bank course. This became one of the factors intensifying pressure on risk assets in late January: CoinDesk analysts directly characterized the Warsh nomination as "bearish for Bitcoin."
Interim summary: A macro trap for crypto
By the end of the first quarter, the macroeconomic environment for cryptocurrencies looked significantly worse than at the start of the year. Instead of the expected continuation of the easing cycle, the market received two consecutive Fed pauses, raised inflation forecasts, an oil shock with unclear consequences, and a slowing labor market.
For the crypto industry, this created direct pressure through liquidity compression. The only consolation was the historical pattern: it is precisely during periods of maximum tightening of expectations that markets form price bottoms from which recovery then begins. The question was simply whether Q1 2026 was that bottom, or merely a prelude to deeper compression.
Source: federalreserve.gov, fred.stlouisfed.org
Geopolitics: The Iran War as a Shock Factor
On February 28, 2026, the United States and Israel launched a joint military operation against Iran. In the following days, Iran closed the Strait of Hormuz, a key corridor for 20% of global oil exports, and began attacking commercial vessels. Oil surged from $70 to over $100 per barrel in just ten days. The IEA called it the largest supply disruption in the history of the oil market. For the crypto market, this became the defining event of the quarter due to the cascade of consequences it triggered.
Crypto as the first-response market
The operation began on a Friday evening. Traditional exchanges were closed, and cryptocurrency became the only liquid market for global capital. Bitcoin fell from $69,000 to the $63,000–$66,000 range over the weekend.
Meanwhile, another crucial development was taking shape: perpetual tokenized swaps in DeFi became the de facto pricing mechanism for oil, gold, and silver while traditional markets remained closed. Oil perps rose 5%, gold contracts gained 1.3%. Institutional traders used crypto derivatives as a "preview" of Monday's opening. This was the moment when crypto stopped being merely a speculative asset and started serving as real-time pricing infrastructure.
Source: coinglass.com
Transmission to crypto: Why war moves tokens
The connection between the Middle East conflict and the crypto market runs through three links. First, the oil shock increases inflation: according to Bloomberg Economics estimates, March CPI in the US could reach 3.4% y/y. Second, rising inflation strips the Fed of the ability to cut rates. Indeed, the March dot plot already shifted toward a longer pause. Third, the resulting 'higher for longer' rate environment compresses liquidity, driving institutional capital from crypto into gold and Treasuries.
Notably, within the conflict itself, Bitcoin performed better than might have been expected. According to CoinShares data, over $2 billion in inflows entered BTC funds since the start of hostilities. BTC rose 10%+ from its conflict lows, which is better than both gold and the dollar over the same period. The narrative of Bitcoin as a "sovereignty-neutral store of value", meaning an asset operating 24/7 beyond any state's control, unexpectedly received practical confirmation precisely when the classic "digital gold" thesis seemed buried.
Source: xbo.com
The window is narrowing
By quarter's end, the development of the conflict remained the main source of uncertainty for crypto markets. Analysts warned that if the Strait of Hormuz is not reopened by mid-April, oil supply losses would double to 10 million barrels per day. Under such a scenario, oil could move above $150, CPI toward 3.5% or higher, and the Fed would face a choice between supporting the economy and fighting inflation. For crypto, this would mean a continuation of the compressed liquidity regime.
The alternative scenario of rapid de-escalation would open the opposite path: oil would fall back to $70–75, the inflation threat would dissipate, the Fed would return to rate cuts, and the crypto market would receive a powerful influx of capital that had accumulated on the sidelines during the crisis. Which of these paths Q2 would take depends on events far beyond the blockchain.
Bitcoin: Under the Hood of the Price Chart
By the start of March, Bitcoin had recorded five consecutive monthly red candles since October 2025, when the price reached its all-time high of $126,000. Such a streak is rare: the last comparable downtrend of similar length was observed in 2022, following the Terra collapse and FTX crash.
However, the internal structure of the decline was fundamentally different from 2022. Back then, the market suffered from an internal crisis of confidence: bankruptcies of major players, cascading liquidations, loss of client funds. In 2026, the pressure was external (coming from geopolitics, inflation, and rates) and virtually did not affect the fundamental infrastructure of the crypto market. This distinction is critically important for interpreting on-chain data.
Long-term holders
The peak of long-term holder distribution occurred in November 2025, when Bitcoin was trading near its all-time high of $126,000. That was when aggregate LTH supply reached its minimum: "smart money" was actively taking profits at the peak of euphoria.
The key on-chain signal of Q1 is that by the start of 2026, the distribution phase was already over. Through December 2025 and into January 2026, aggregate LTH supply began to grow steadily: long-term holders transitioned from selling to accumulation, gradually building positions even against the backdrop of falling prices.
A critically important piece of context is that the Q1 2026 market fall was not caused by long-term holders dumping coins, but by pressure coming from short-term speculators, liquidated derivative positions, and institutional ETF outflows. "Smart money" was quietly buying during this period, which is a classic pattern that precedes trend reversals.
In parallel, the Spent Output Profit Ratio for LTH dropped below 1, indicating that the few coins still being sold by long-term holders were being realized at a loss. Historically, such episodes have been extremely rare and coincided with the final phase of capitulation before a reversal, as seen in March 2020 and November 2022.
Exchange reserves: Record shortage of liquid supply
Bitcoin reserves on centralized exchanges dropped to 2.7 million BTC, representing just 13% of total circulating supply. Coins are moving into cold storage, corporate treasuries, and self-custody. This creates structural tension: the supply available for sale is shrinking, while demand, despite slowing, remains supported by ETF inflows (total Q1 net inflows into BTC ETFs amounted to $304 million), corporate purchases, and sovereign reserves.
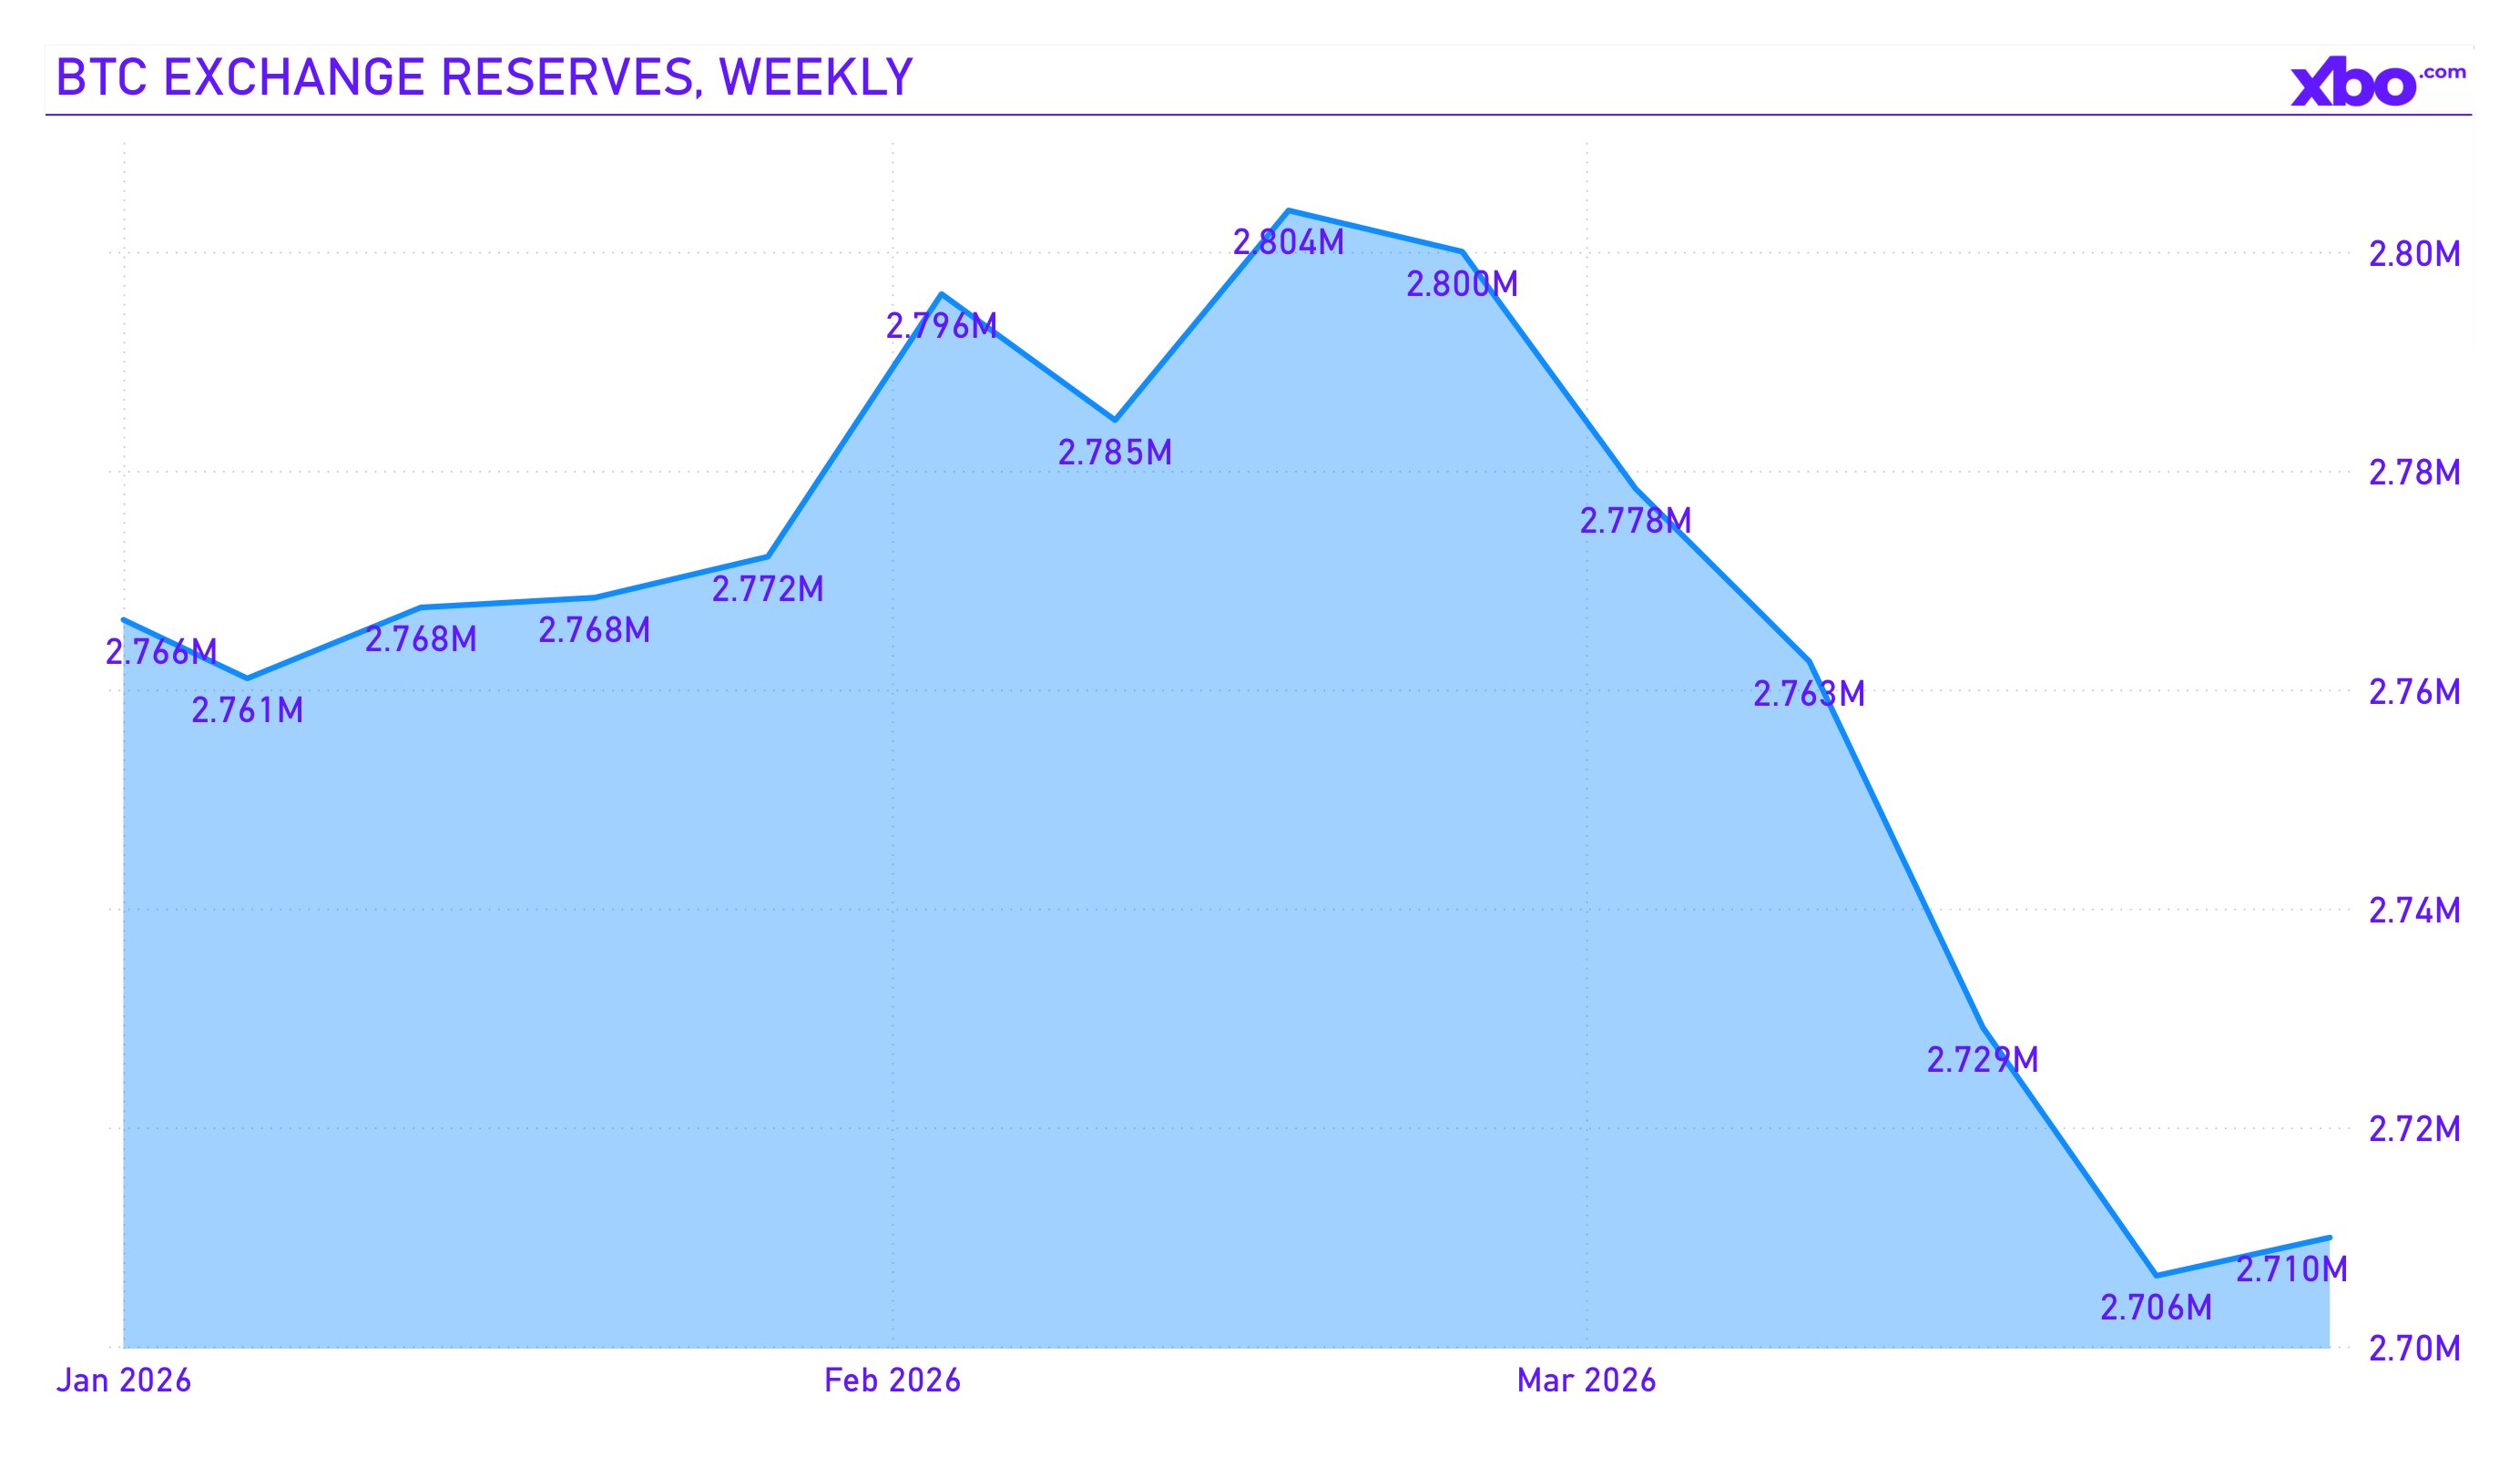
Source: cryptoquant.com
Miners: Capitulation and restructuring
Miners found themselves under severe economic pressure. After the April 2024 halving, the block reward was reduced to 3.125 BTC, which at current prices means daily issuance of approximately 450 BTC. The average cost of mining one BTC is estimated at $88,000, and so miners are operating at a loss of approximately 21%.
Hash rate has declined since November 2025. This points to miner capitulation: the least efficient operators are shutting down equipment or liquidating treasury reserves. Core Scientific announced the sale of 2,537 BTC in Q1, while Cango Inc. sold 4,451 BTC in a single weekend.
For the market, this is likely a positive signal. Miner capitulation historically coincides with price bottoms: similar patterns were observed in June–July 2022, immediately before the formation of that cycle's bottom. When the least efficient operators exit, the network rebalances, difficulty decreases, and the remaining miners become profitable at lower prices, creating a more sustainable base.
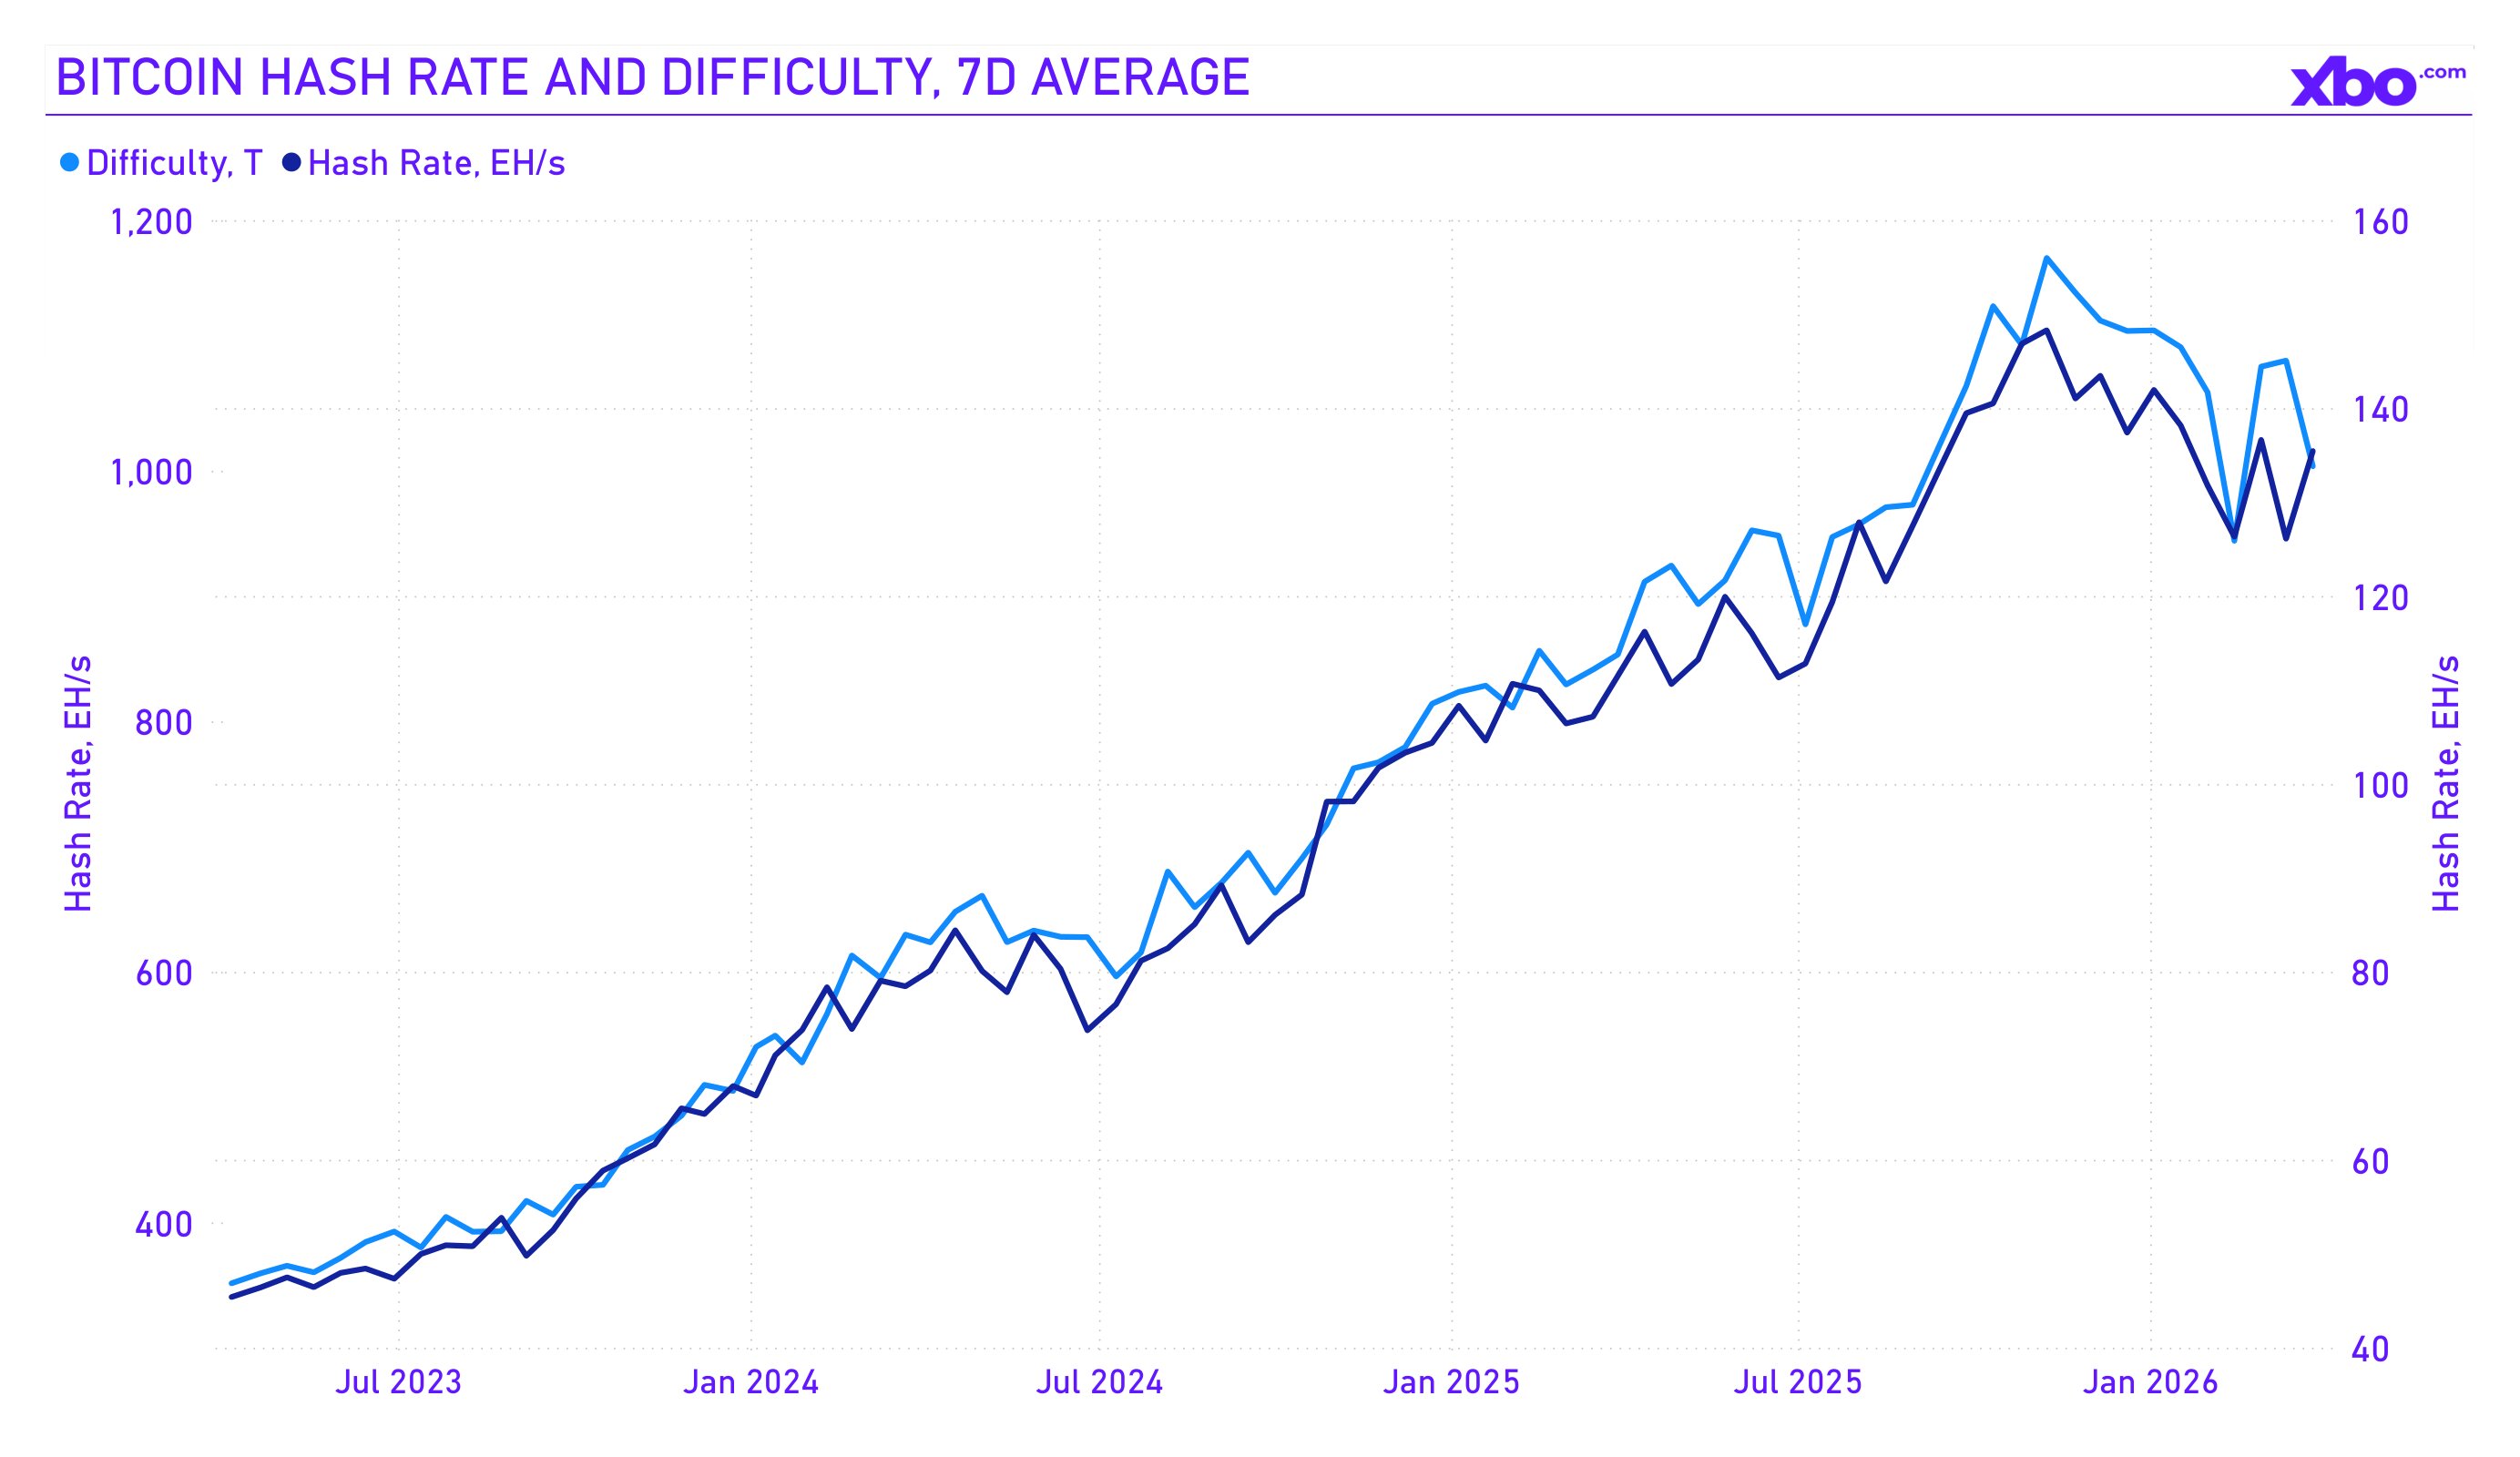
Source: blockchain.com
MVRV and valuation: "Opportunity" zone or "Trap"?
Market Value to Realized Value is a key on-chain indicator comparing current market capitalization with "realized" capitalization. This indicator's dynamics over the past year tell the story of the cycle in a single number.
In July–August 2025, when BTC was trading near $118,000–$119,000, MVRV reached peak values of 2.38–2.39, a zone of historically elevated valuations, though far from the extremes of previous cycles. From the October price peak, a steady decline began. By December 2025, MVRV had dropped below 2.0, and by January 2026 it had fallen further below 1.6.
The MVRV minimum for the quarter was recorded at the end of February 2026: 1.23 at a BTC price of $64,000. This is a level close to the zone that Glassnode analysts classify as "anxiety." For comparison, at the absolute minimums of previous cycles, MVRV dropped below 1.0, meaning the average holder was at a loss. The current value of 1.23–1.24 at the end of March suggests that the market has approached the "opportunity" zone but has not yet reached the zone of total capitulation.
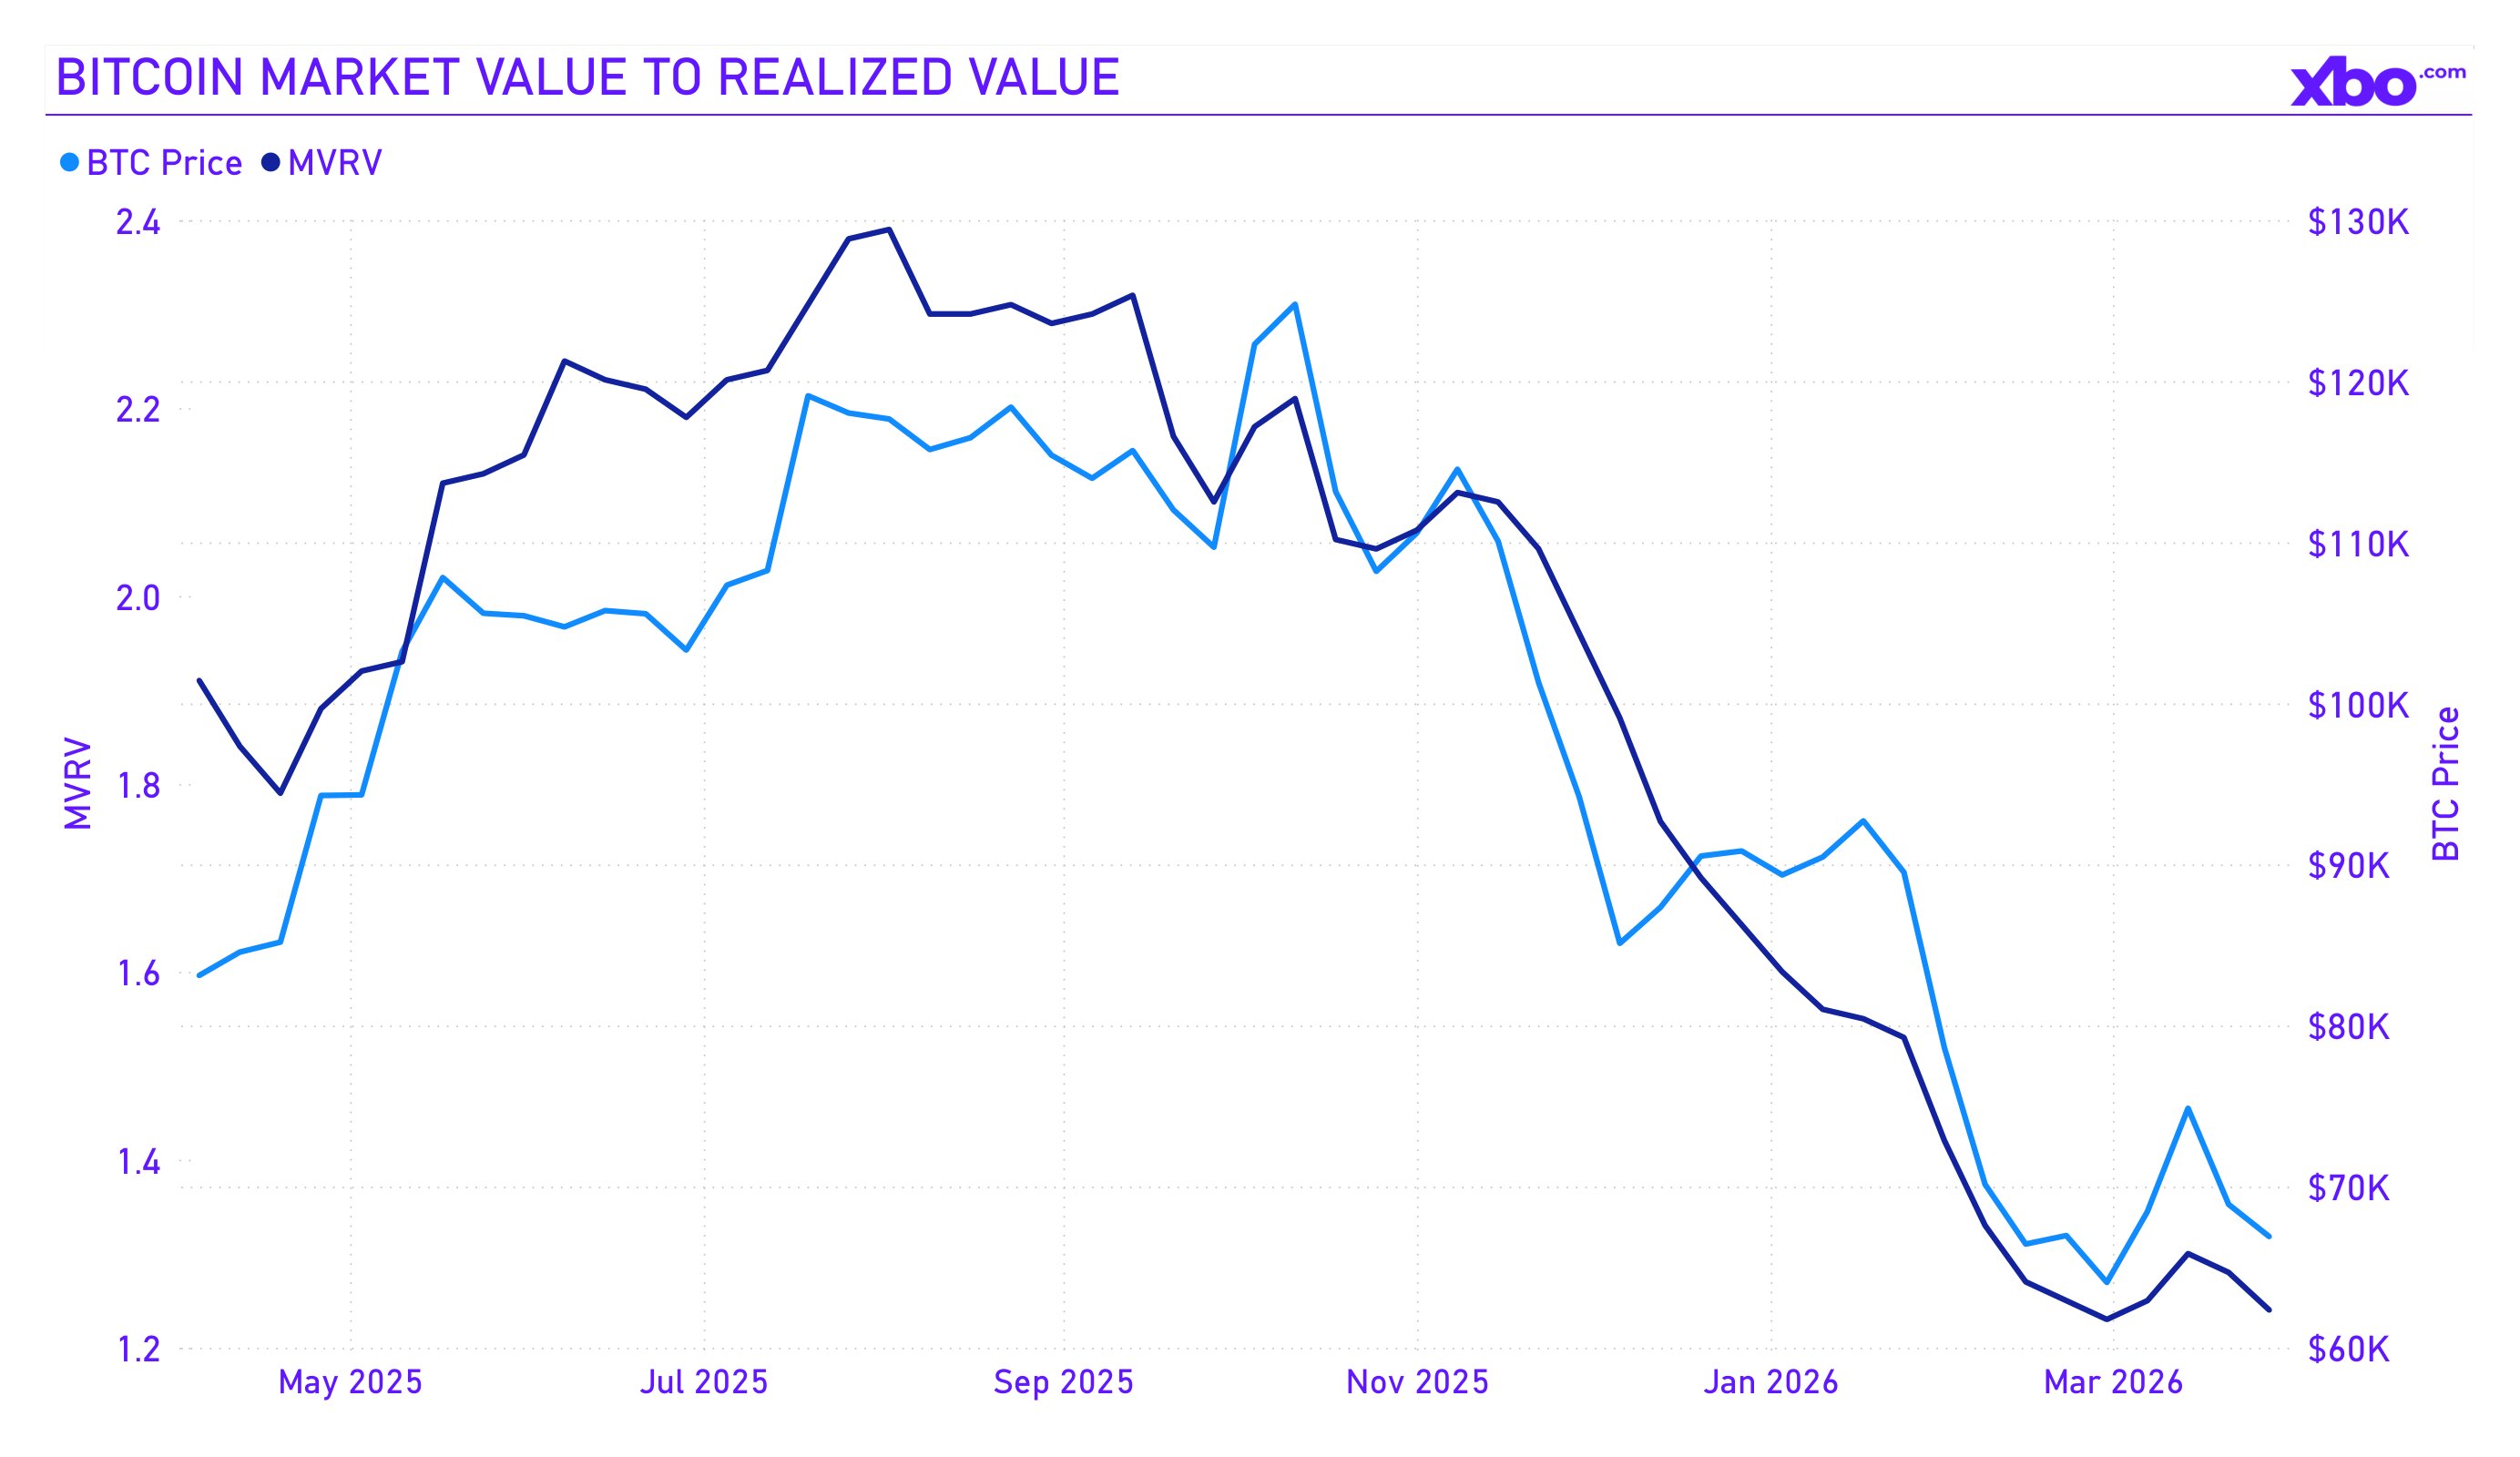
Source: blockchain.com
The totality of on-chain data paints a picture of a market that has completed its active distribution phase and is in a transitional zone. Positive signals include cessation of LTH selling, record-low exchange reserves, capitulation of weak miners, MVRV levels, and sustained demand through ETFs and corporate treasuries. Negative ones mostly manifest in unresolved macro and geopolitical risks.
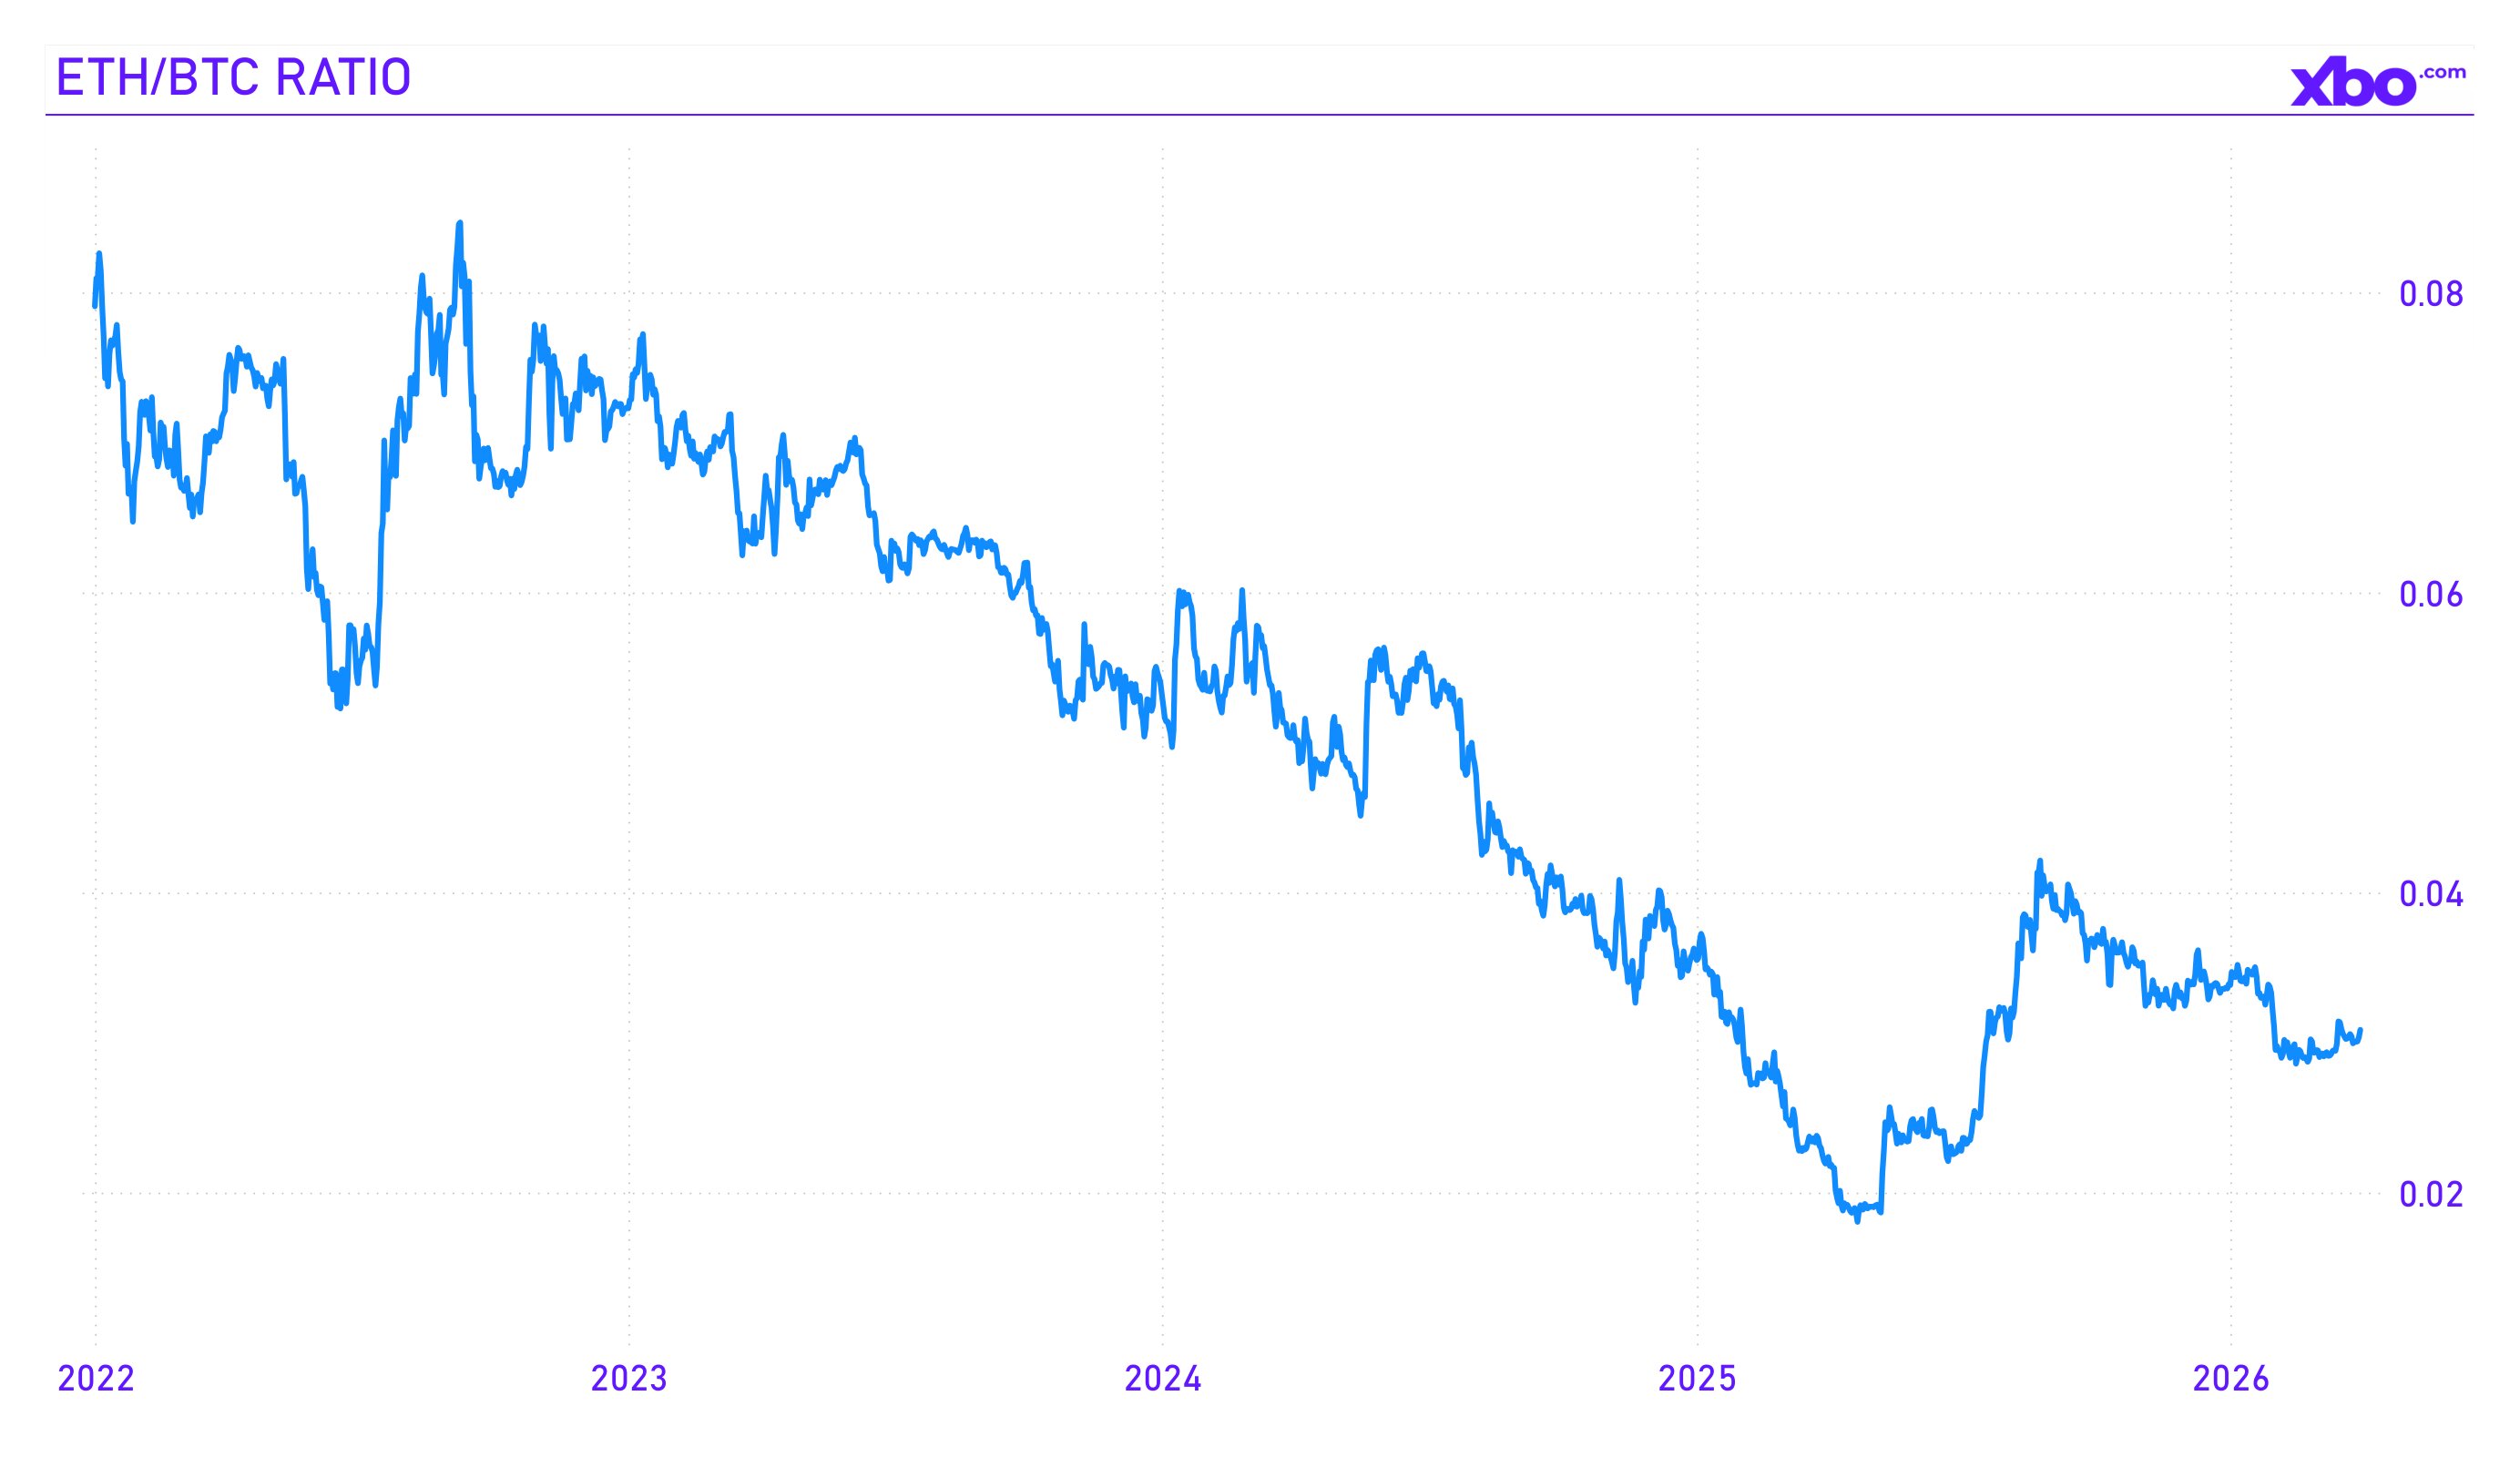
Ethereum and Altcoins: Price Falls, Ecosystem Grows
While Bitcoin lost 22% in Q1 2026, Ethereum underperformed even more sharply: quarterly returns came in at approximately −29%, and from the August 2025 peak, ETH fell 58%. By the end of March, ETH was trading near $2,100–$2,200 with a market capitalization of approximately $233 billion. Six consecutive monthly red candles marked a record streak for the second-largest crypto asset.
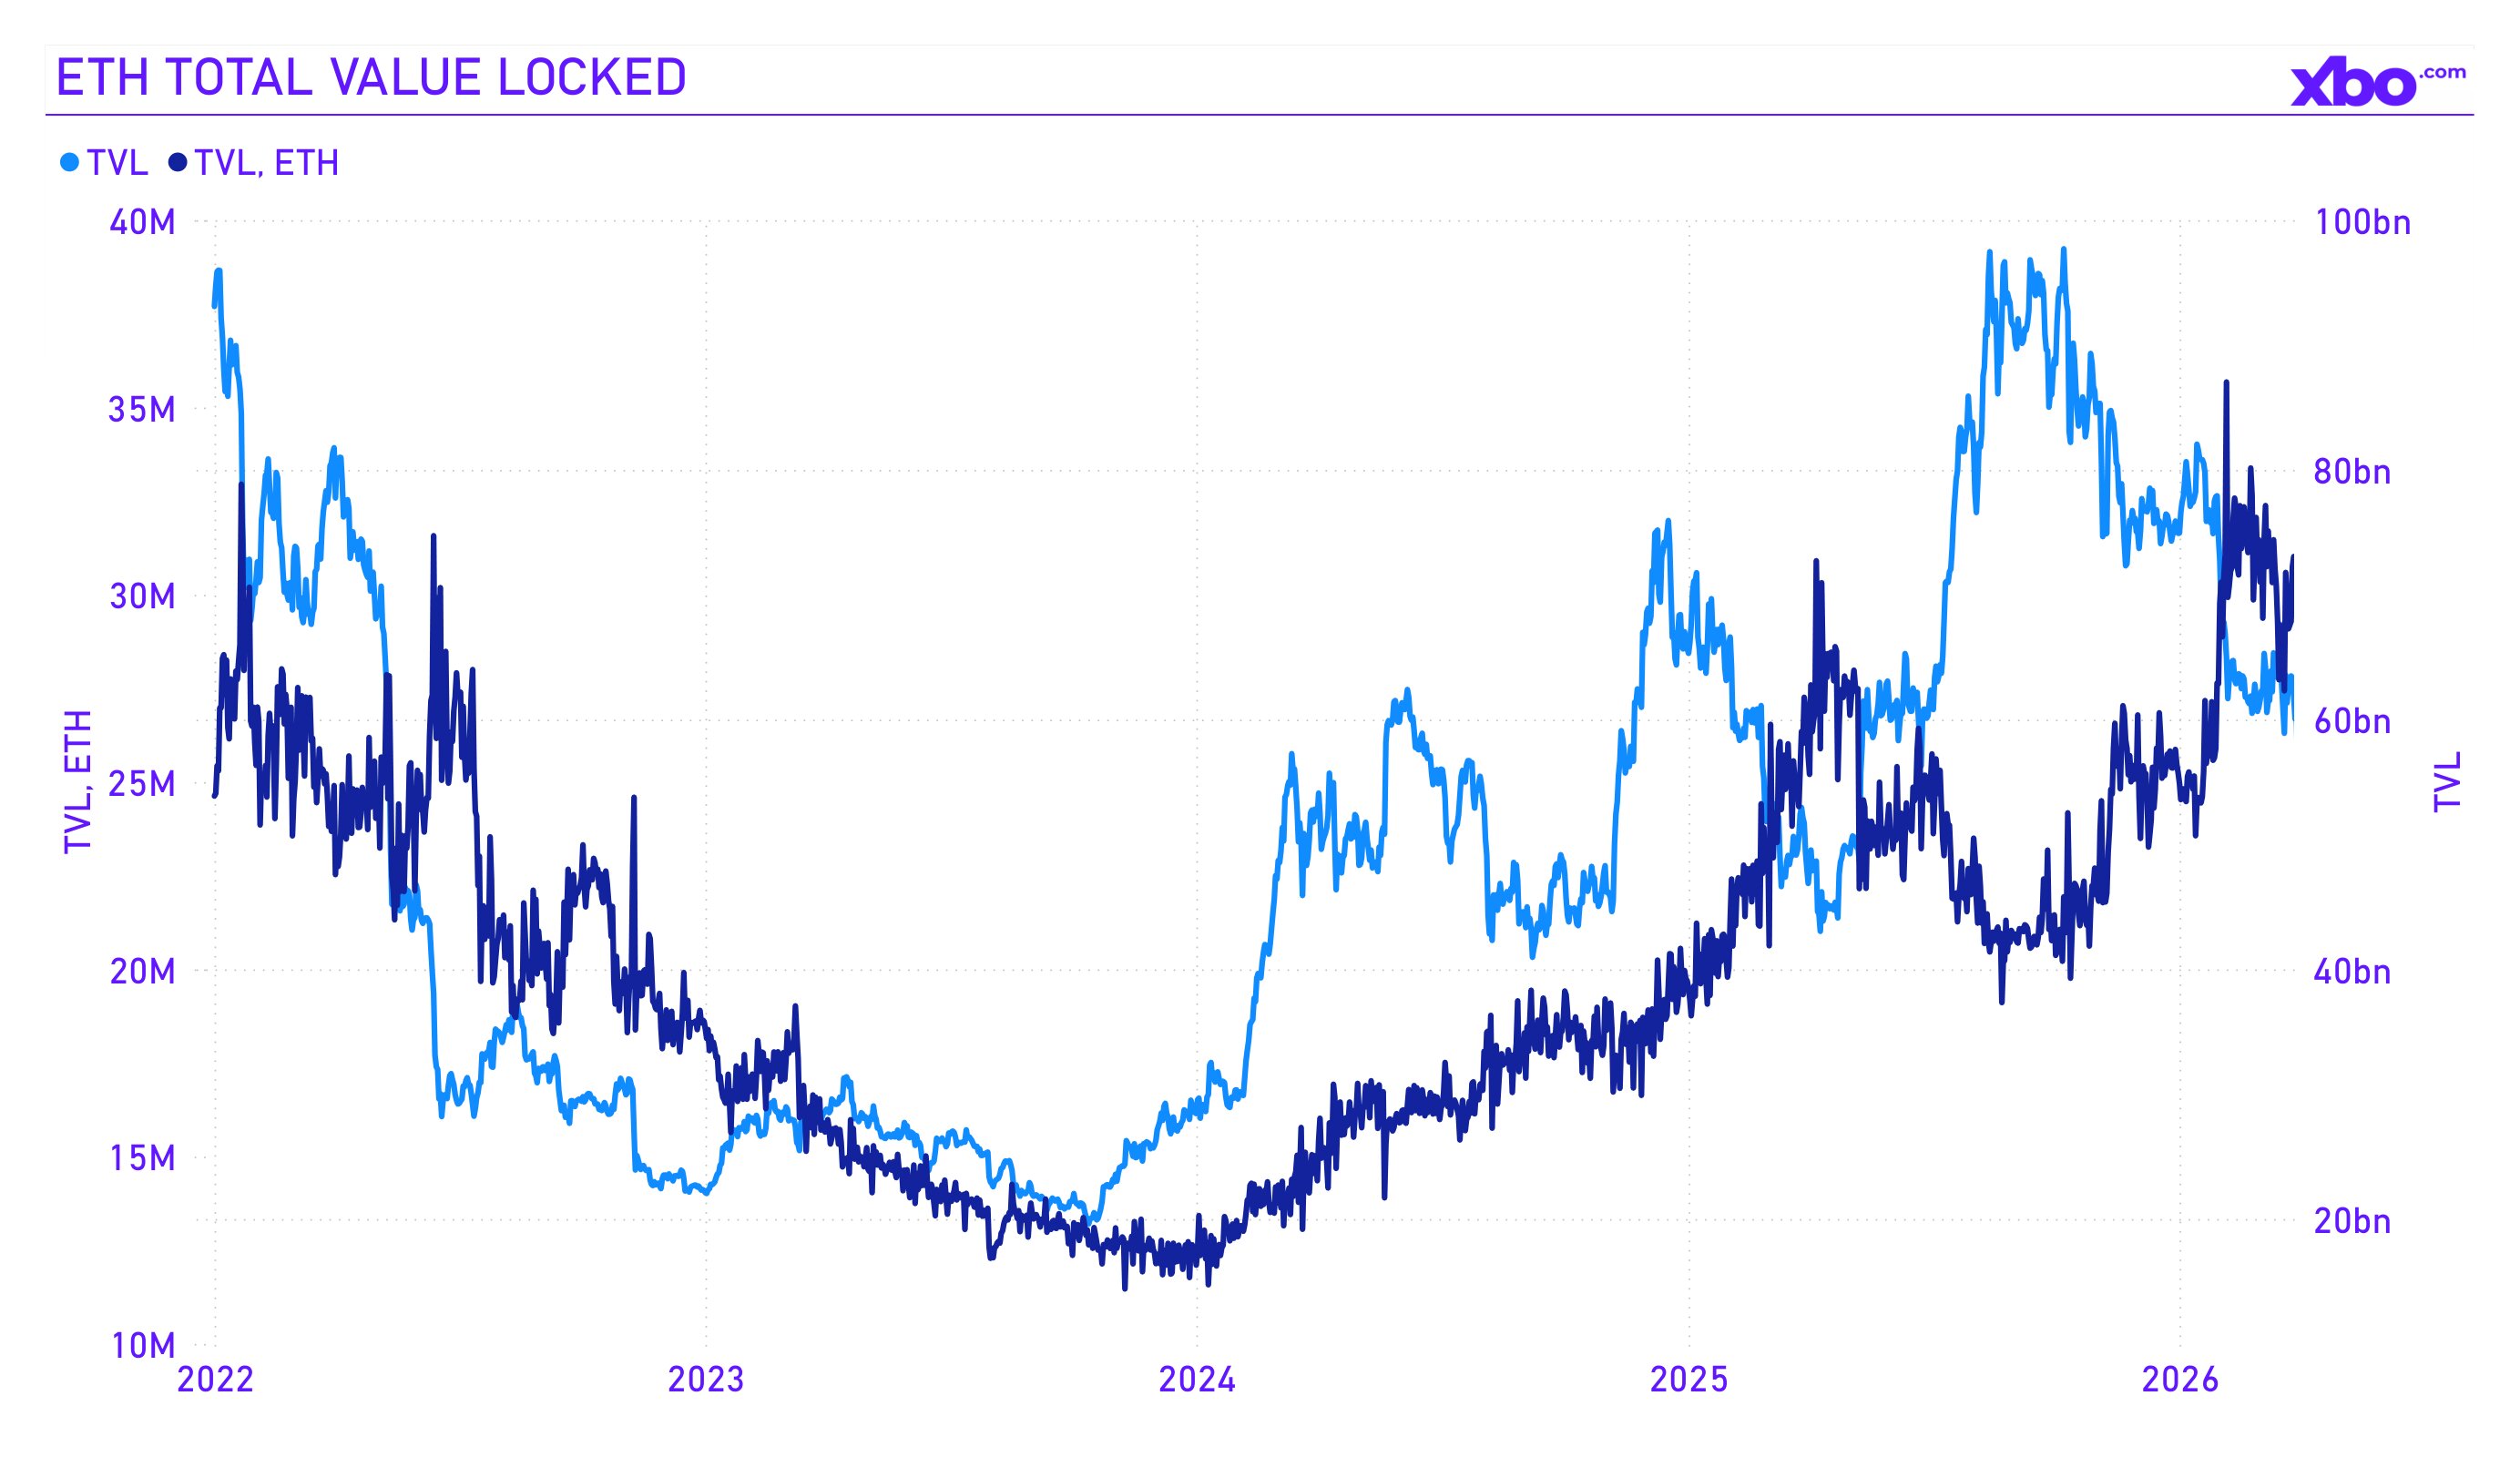
DeFi liquidity
Ethereum maintained its dominance, with 57–68% of all DeFi TVL in its ecosystem. The largest protocols demonstrated resilience, with Lido holding $38 billion in liquid staking, Aave $24–27 billion in lending (after crossing the $1 trillion mark in cumulative loans), and EigenLayer $13 billion in restaking. Approximately $140–166 billion in stablecoins (more than half of the global supply) were deployed on Ethereum, reinforcing its role as the primary settlement layer for digital dollar infrastructure.
L2: Scaling works, but value leaks
Ethereum L2 solutions like Base, Arbitrum, Optimism, Linea, and zkSync reached a combined TVL of $9 billion and $40.5 billion in Total Value Secured. Coinbase's Base became the leader among L2s with TVL of $4 billion, surpassing Arbitrum. This confirms that Ethereum's rollup scaling strategy is working technically.
However, for ETH's price, L2s create a structural problem. Average fees on Ethereum L1 fell to historic lows of approximately $0.14 in January 2026, as L2s are taking transactions from the base layer, leaving it with only the role of a settlement layer. As a result, L1 fee revenue declined. This undermines the deflationary thesis, which was one of the key bullish arguments of 2023–2024 and under which, after the Merge, ETH was supposed to become deflationary through fee burning. As CoinStats analysts noted, "L2s demonstrate successful scaling but create structural problems for Ethereum L1 value capture."
Altcoins: Rotation, not flight
The broader altcoin market suffered more than BTC and ETH. Solana was trading around $83 by the end of March. Dogecoin lost over 50%, XRP fell from $2.40 at the start of the year to $1.35 in March. Bitcoin dominance stood at 58%, reflecting the classic risk-off pattern: capital flows from riskier alts into the "relatively safe" BTC.
However, within the altcoin space, individual pockets of growth emerged. XRP ETFs attracted steady inflows: the SEC was reviewing applications for spot XRP products with a March 27 deadline, which sustained investor interest in the asset. Hyperliquid (HYPE) rose 55% from its 2026 lows, as the platform became a primary tool for hedging commodity risk through perpetual contracts on oil and gold. Real-world asset (RWA) tokenization protocols, including products from BlackRock and Franklin Templeton, continued to attract capital, perceived as a bridge between TradFi and DeFi.
Source: tradingview.com
The ecosystem paradox: Worst price, best infrastructure
One of the key takeaways from Q1 2026 is how it exposed the gap between Ethereum's price dynamics and the state of its ecosystem. The price fell, yet the amount of ETH in DeFi grew, and the volume of stablecoins on the network increased.
This pattern is not new for Ethereum, as the network experienced similar divergences in 2018–2019. However, the scale of current adoption, backed by institutional capital and regulatory clarity (including GENIUS Act and MiCA), makes the present situation qualitatively different. The key question for Q2 and beyond is whether the fundamental development of the ecosystem can ultimately pull the price up, or whether L2 cannibalization and competition from Solana will structurally limit ETH L1 value capture.
Source: defillama.com
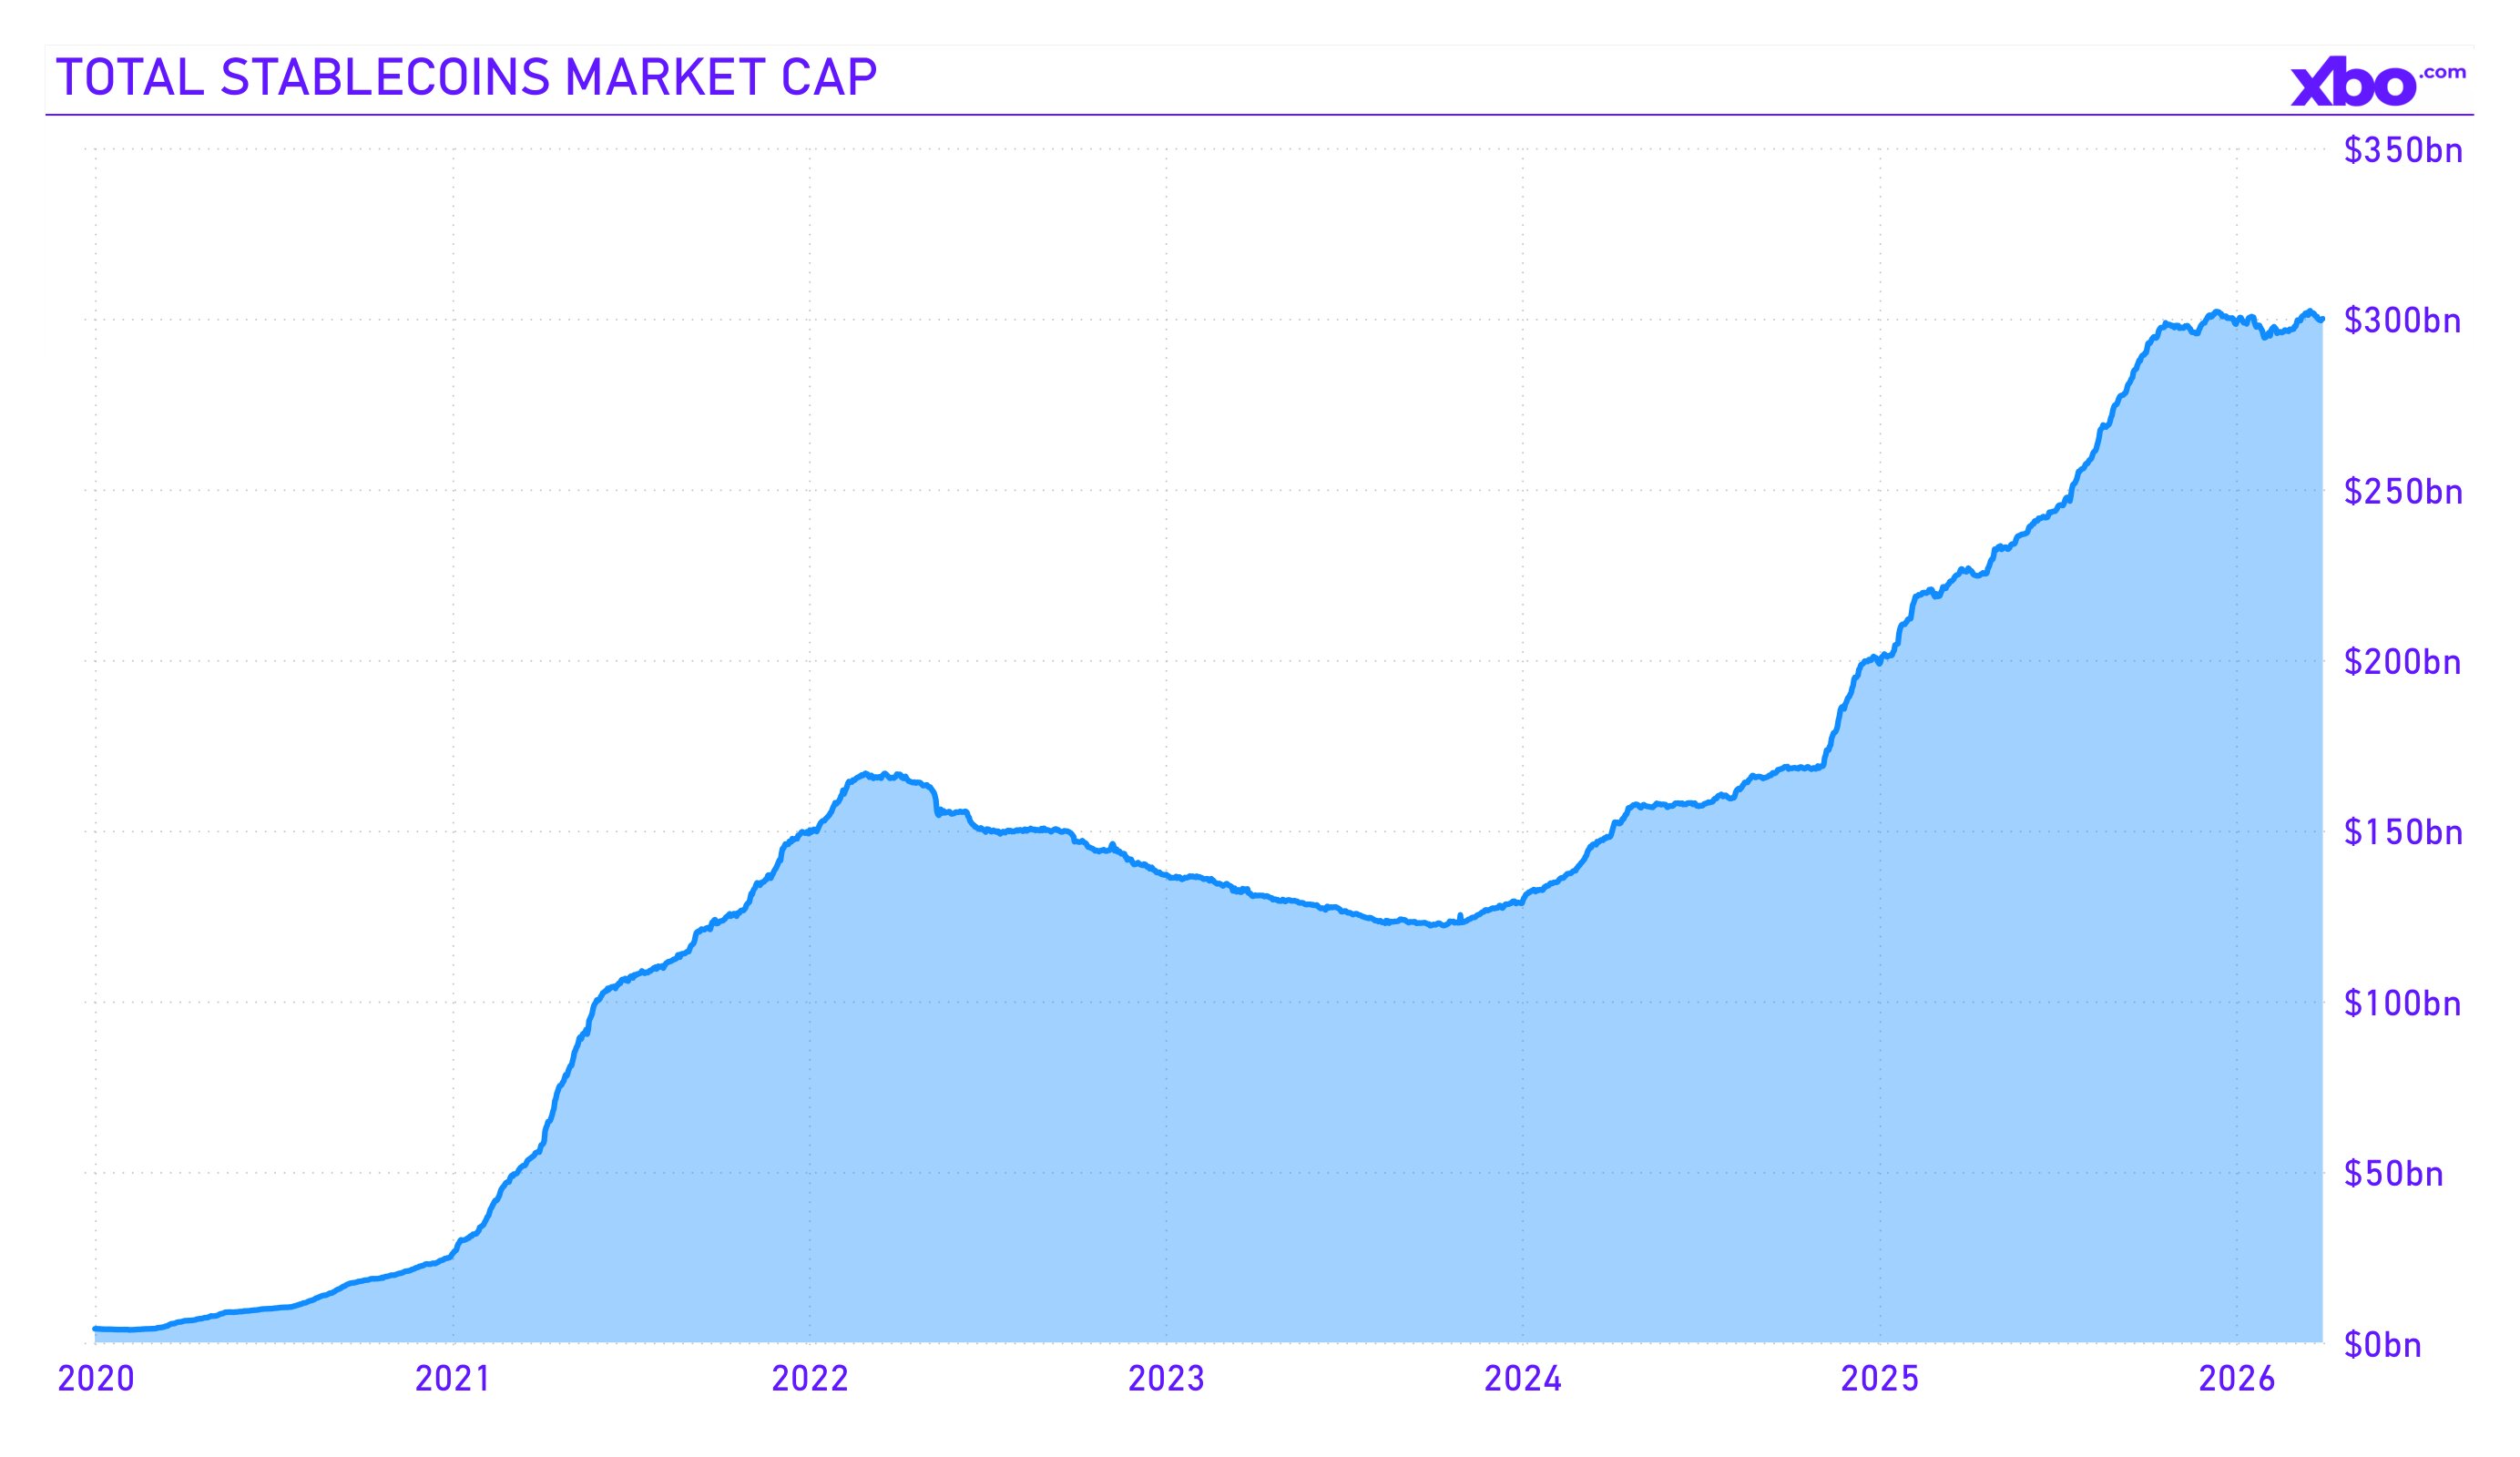
Stablecoins
While the crypto market was losing trillions of dollars in capitalization, one segment of the industry that continued to grow was stablecoins. Total stablecoin market capitalization by the end of Q1 2026 approached $300 billion, growing by $1.38 billion over the quarter. Stablecoins became the only major crypto segment that grew consistently through all market phases, including bull rallies, bear crashes, and geopolitical shocks.
Source: app.rwa.xyz
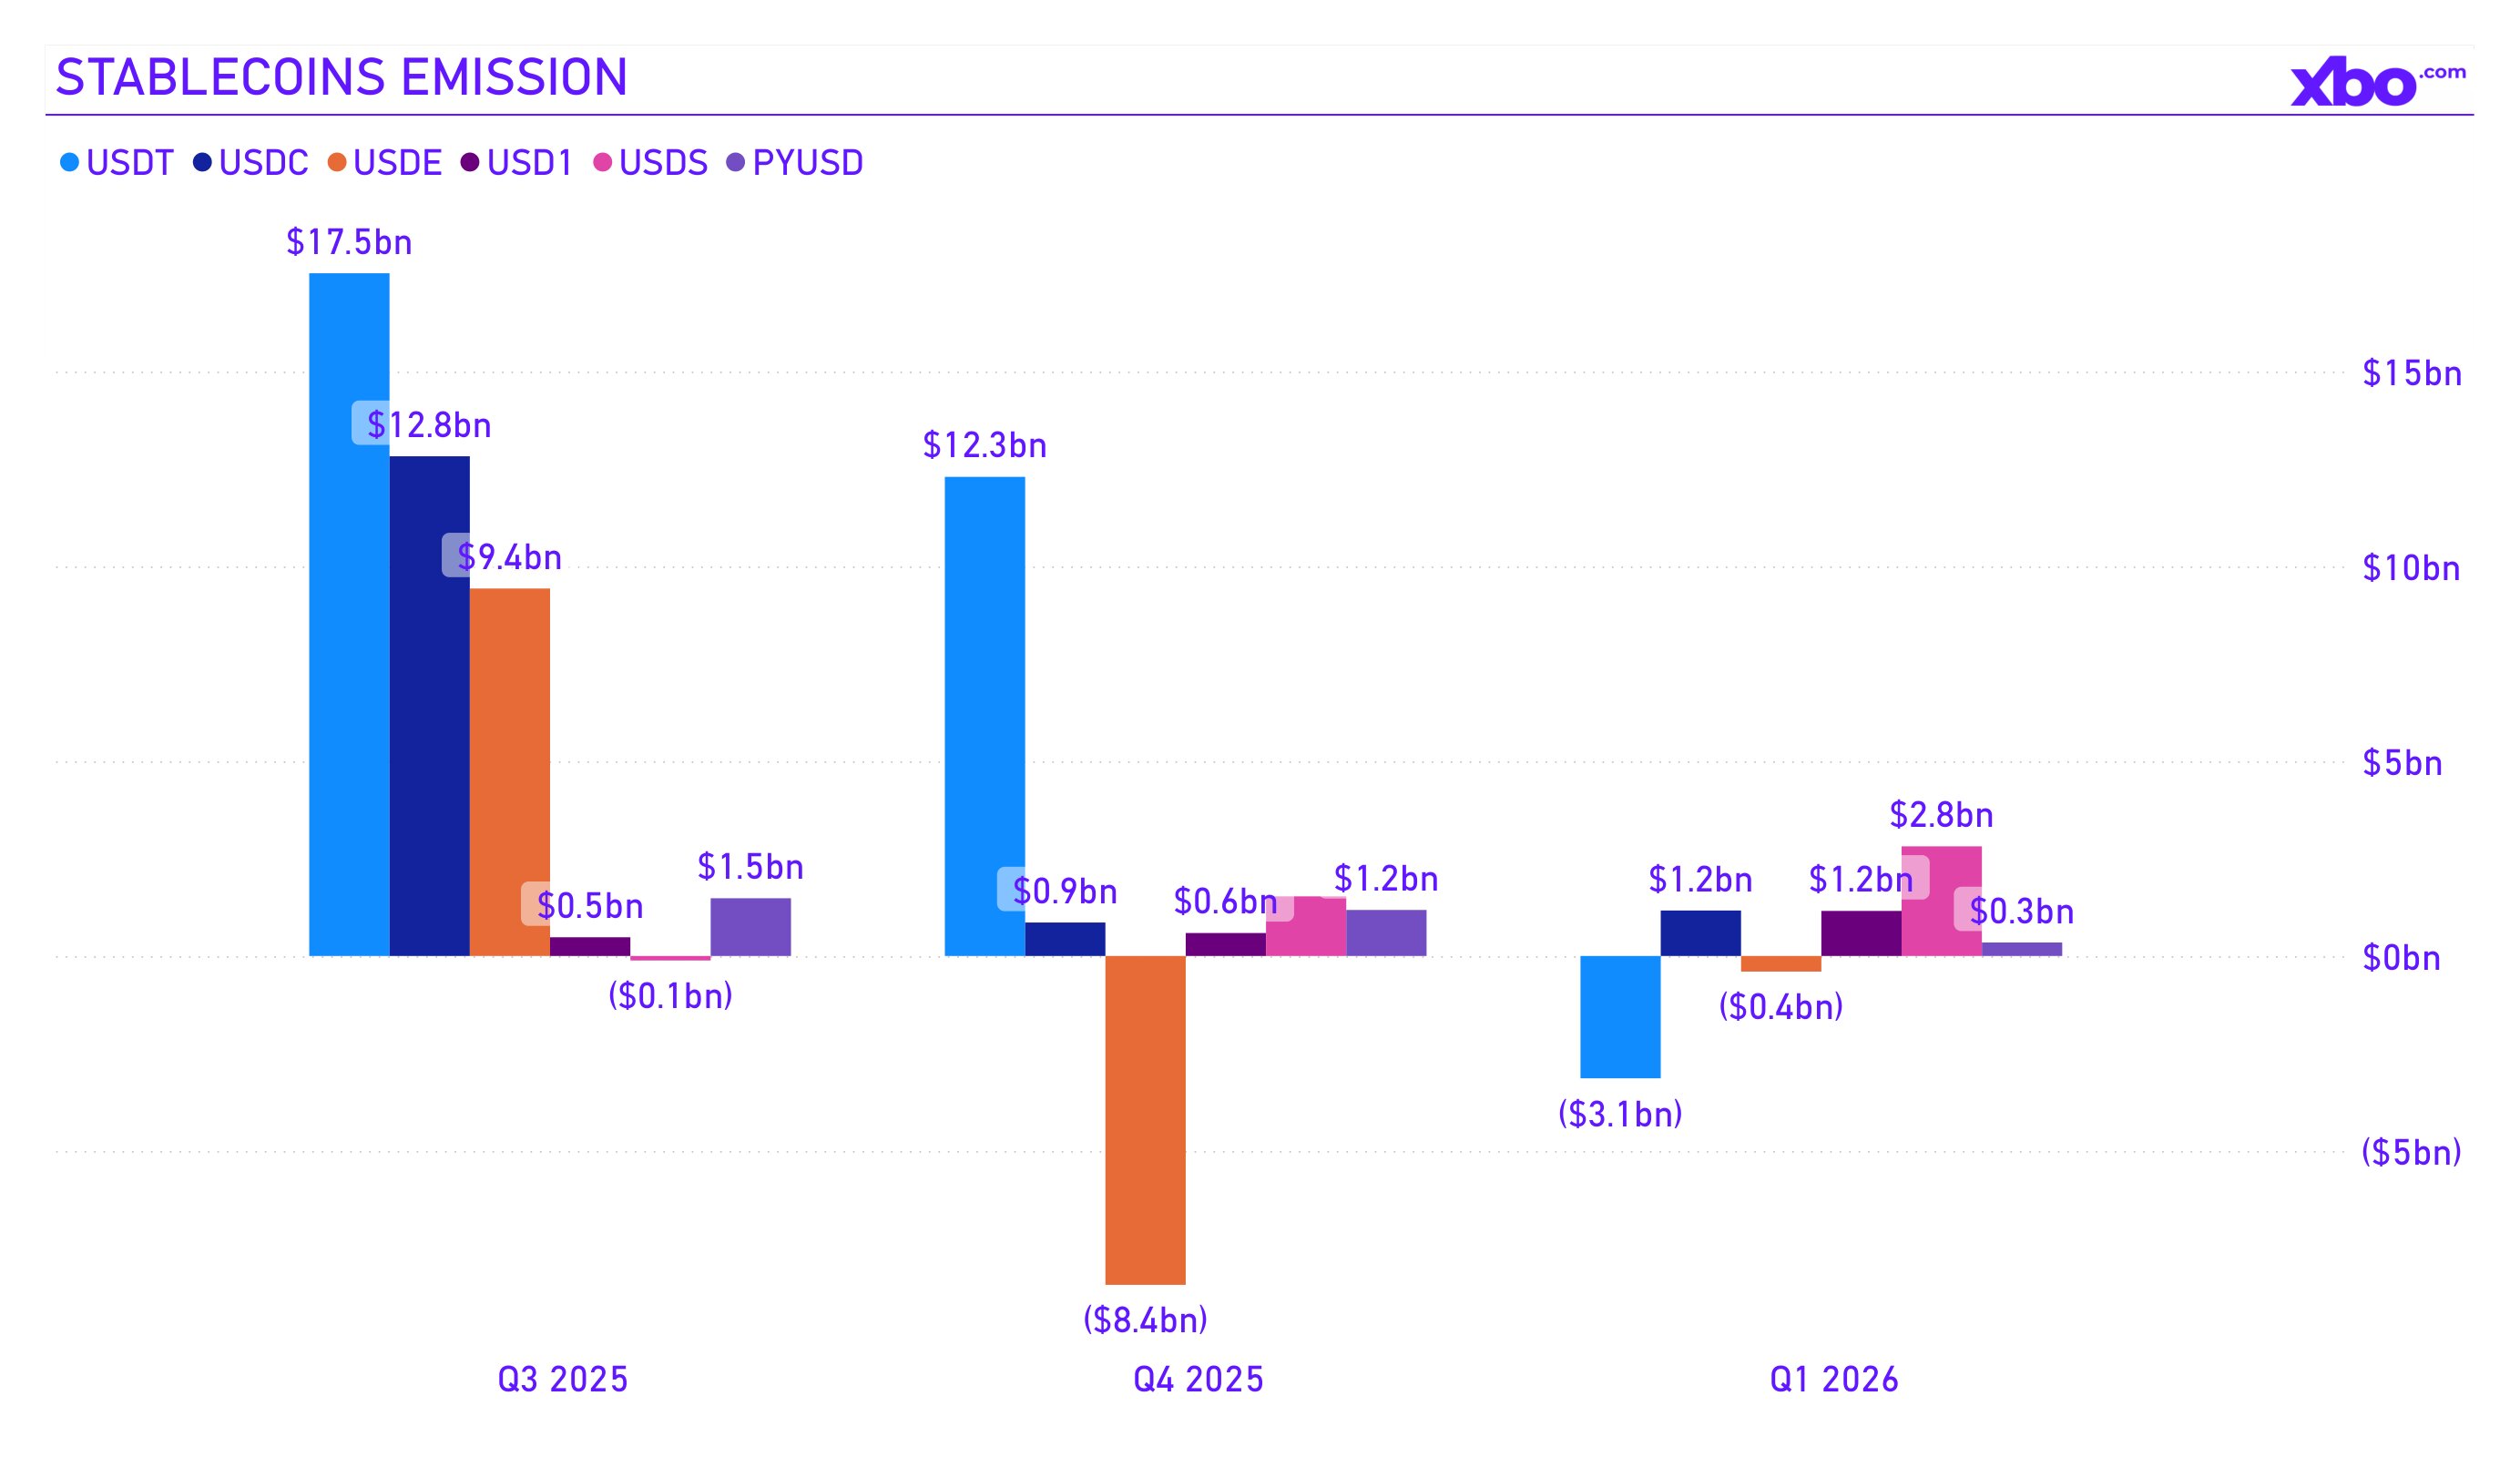
A change of the guard among issuers
Net stablecoin issuance for the quarter was +$1.38 billion. This result is positive but notably more modest than +$6.4 billion in Q4 2025 or +$41.8 billion at the Q3 2025 peak. Behind this aggregate figure lies a reshuffling of forces among issuers.
USDS (formerly DAI) became the undisputed leader of the quarter with net issuance of +$2.81 billion, the largest quarterly increase among all top stablecoins. This continues the trend: after rebranding and transitioning to the Sky model in 2025, USDS consistently grew its supply, becoming one of the main beneficiaries of DeFi liquidity.
USD1, a stablecoin associated with World Liberty Financial, attracted +$1.16 billion for the quarter. Launched only in Q2 2025, it rapidly gained scale, fueled by political narrative and integrations with crypto platforms.
USDC from Circle showed moderate growth of +$1.17 billion, which was a significant deceleration after +$12.8 billion in Q3 2025 and +$15.6 billion in Q1 2025. This reflects both the overall market cooling and increased competition from new issuers.
PYUSD from PayPal added +$347 million, a modest but stable result confirming the payments giant's presence in crypto.
Meanwhile, for the first time in a while, Tether (USDT), historically viewed as a dominant market player, recorded a significant negative net: −$3.14 billion for the quarter. This was a sharp reversal after a series of strong quarters: +$17.5 billion in Q3 2025, +$12.3 billion in Q4 2025. The reasons likely include redemptions amid risk-off, competition, and regulatory pressure amid the implementation of the GENIUS Act, which establishes strict requirements for reserves and transparency.
USDe from Ethena also lost −$400 million, continuing the correction after explosive but short-lived growth in Q3 2025. This algorithmic stablecoin based on hedged positions came under pressure amid high volatility and negative funding.
Source: app.rwa.xyz
Stablecoins as a liquidity buffer
Under the crisis conditions of Q1 2026, stablecoins performed a critical function of "capital parking." When investors exited volatile crypto assets, they did not necessarily move to fiat. Instead, a significant portion of capital moved into USDT, USDC, and USDS, staying "on crypto rails" and ready for a quick return to risk positions when the market reversed. This is clearly visible in the fact that stablecoin supply did not contract even as BTC fell 23% and ETH lost 32%.
Stablecoins also became a geopolitical hedging instrument. Under conditions of the Strait of Hormuz closure and the oil shock, investors in countries dependent on dollar liquidity (including those in Southeast Asia, the Middle East, and Latin America) used stablecoins as a fast, cheap, and banking-independent substitute for dollar access, particularly as traditional financial infrastructure came under pressure from sanctions and geopolitical instability.
GENIUS Act: Regulatory foundation and new competition
The regulatory landscape for stablecoins changed dramatically after the July 2025 signing of the GENIUS Act, the first major crypto law in the United States. The law establishes a framework for "permitted payment stablecoins": mandatory 1:1 backing with cash or short-term Treasuries, monthly reserve disclosure, holder protection in the event of issuer bankruptcy, and oversight by the OCC, the Fed, or the FDIC, depending on issuer type.
By Q1 2026, regulators had moved from lawmaking to implementation. In February, the OCC published a 376-page proposed rule for issuer licensing, which drew a mixed response from the industry. The main point of tension was the prohibition on interest payments on stablecoins by issuers. The banking lobby insisted that stablecoin yield undermines banks' deposit base; the crypto industry argued that the law allows third parties to offer rewards on stablecoins. This dispute became one of the key bargaining points in the discussion of the CLARITY Act, a broader law to regulate digital asset market structure.
In parallel, the GENIUS Act created a window for new players. Applications for OCC bank licenses for stablecoin issuance were filed by several major financial institutions. The deadline for publishing implementing rules is set for July 18, 2026, which means the second half of the year will be decisive for shaping the competitive landscape. Tether, based outside US jurisdiction, finds itself in a vulnerable position: the new rules effectively set standards for all stablecoins serving American clients, and according to some expert assessments, USDT has historically been less transparent on reserve matters than the law requires.
Is $300 billion just the beginning?
According to Coinbase Institutional forecasts, stablecoin market capitalization could reach $1.2 trillion by the end of 2028. Given current growth rates and regulatory clarity, this does not look improbable: over 2025, the market grew from $135 billion to $300 billion, more than doubling in size. Stablecoins have ceased to be a niche crypto trading instrument and have evolved into global payments infrastructure.
For the crypto market as a whole, the resilience of stablecoins against the Q1 crash is a positive structural signal. Capital did not leave the ecosystem but moved to a "waiting zone," ready to rotate back into risk assets when the macro environment improves. $300 billion in stablecoins is potential dry powder for the next bull cycle.
Conclusions and Expectations for Q2–Q4 2026
Q1 2026 was a quarter of paradoxes for the crypto market. Prices crashed 22–29%, the Fear & Greed Index spent 46 days in the extreme fear zone, and liquidations were measured in billions — all this while the industry's fundamental infrastructure not only held but continued to strengthen. Long-term holders were building positions, BTC exchange reserves fell to multi-year lows, the volume of ETH in DeFi protocols grew, stablecoins held capitalization near $300 billion, and, for the first time in history, the regulatory environment was working more in the industry's favor than against it.
The market entered Q2 not in a state of collapse, but as a compressed spring. Where it uncoils depends on two fundamentally different macro scenarios.
Scenario 1: Prolonged shock (Inflation takes hold, liquidity compresses)
This scenario assumes that the main damage to the macroeconomy has already been done and its consequences will unfold over several quarters, regardless of the speed of de-escalation in the Middle East.
The arguments in favor of this scenario are substantial. According to Capital Economics estimates, even with a relatively quick resolution of the conflict, if the average oil price in 2026 is $100 per barrel, US CPI will rise to 3.5% by year's end. RBC Economics warns that with WTI above $75, headline inflation will exceed 3% as early as Q2, and at $100 it will remain above 3% for the entire year. Bloomberg Economics already estimates March CPI at 3.4% y/y, a jump of a full percentage point in a single month.
In this scenario, the Fed is not simply delaying rate cuts but may be forced to consider raising them. As early as March, seven of nineteen FOMC members expected no cuts in 2026, and the January meeting minutes recorded that some officials acknowledged the possibility of tightening.
For crypto, this means continued price pressure in Q2–Q3, with a possible test of the $50,000–$55,000 level for BTC. ETH could decline to $1,500. Institutional ETF flows will remain volatile with a bias toward outflows. Gold will continue to outperform crypto as the preferred safe haven.
However, even in this scenario, the depth of the decline can be limited by structural anchors, including $300 billion in stablecoins, corporate purchases (Strategy continues to buy BTC every week), depletion of exchange reserves, and MVRV approaching the zone of historical minimums. Glassnode analysts note that the Realized Profit/Loss Ratio has been below 1 since February, and if the pattern of previous cycles repeats, a structural bottom could form by August–September 2026.
Scenario 2: De-escalation (Liquidity returns, the cycle restarts)
This scenario assumes that the conflict with Iran concludes or significantly de-escalates in Q2, the Strait of Hormuz reopens, and oil prices return to fundamentally justified levels.
J.P. Morgan's base case forecast expects Brent at $60 per barrel with supply normalization, and Capital Economics calls a "most likely" scenario of a short-term conflict followed by an oil pullback to $60–75. If this materializes, the inflation threat dissipates: February CPI data (2.4%) remains relevant, the oil shock proves temporary, and the Fed gains room to resume rate cuts, possibly as early as according to CME FedWatch pricing.
For crypto, this opens the path to a powerful recovery in the second half of the year, fueled by several catalysts:
Monetary easing. Even a single Fed rate cut has historically served as a powerful signal for risk assets.
Halving cycle. The April 2024 halving cut BTC issuance in half. Historically, the largest price moves occur 12–18 months after a halving, meaning the potential window falls on April–October 2026. The current supply deficit creates structural upward pressure when liquidity returns.
Regulatory clarity. Implementation of the GENIUS Act and potential passage of the CLARITY Act before the November midterm elections could unlock new categories of institutional capital. Coinbase forecasts that the stablecoin market will reach $1.2 trillion by 2028, and the regulatory framework is a key condition for this growth.
ETF infrastructure. Expansion of the spot ETF lineup, opening access through retirement accounts, and wealth management platforms such as those at Bank of America, Wells Fargo, and Morgan Stanley create a continuously expanding funnel of institutional demand.
In its 2026 outlook, Grayscale directly states: the crypto bull market continues, and the Q1 correction marks "the end of the four-year cycle", with a transition to a more mature, institutionally driven market model where deep drawdowns are shorter and less destructive. Coinbase Institutional maintains a constructive view, noting that macro tailwinds, such as productivity growth and resilient GDP, create a backdrop "more reminiscent of 1996 than 1999", meaning the middle of a growth cycle, not its peak.
What will determine the outcome
What happens next will not be decided on the blockchain. The answer lies in the Strait of Hormuz, in the FOMC meeting room, in the Senate corridors where the fate of the CLARITY Act is being decided, and in the negotiation rooms where a ceasefire is being discussed. Cleansed of leverage, with record-low exchange reserves, with institutional infrastructure that did not exist in any previous cycle, and with $300 billion in stablecoins on the sidelines, the crypto market is ready for a sharp move in either direction.
The only thing that can be stated with confidence is that what happened in Q1 2026 was no ordinary correction. It was that quarter that the crypto industry, for the first time, fully encountered the reality of a global geopolitical crisis, only to discover that its infrastructure held firm, even if prices did not.